Annual Highway Report Analyzes State Highway Systems’ Performance: Virginia Drops To 21

Share this article on:

Reason Foundation recently released its 25th Annual Highway Report, a yearly evaluation of the conditions and cost-effectiveness of state highway systems. The report uses data reported by states to the Federal Highway Administration (FHWA) as a condition of receiving their federal highway funding. The FHWA data are supplemented with bridge data from Better Bridges magazine and congestion data from INRIX. The report compares each state’s highway spending against its highway system’s performance to provide policymakers and taxpayers with an assessment of value-for-money spent.

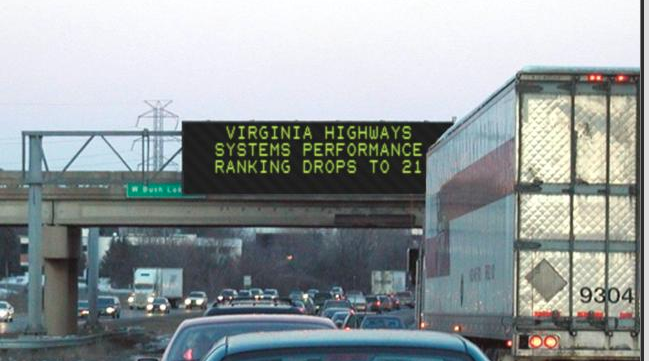
Continuing a national trend over the last 20 years, the overall state highway system performance improved slightly. Most of the trouble spots are concentrated in the lowest-scoring 10 states, which have a disproportionate share of the highway problems and reduce the overall system performance.

This year’s Annual Highway Report examines 13 categories; four categories measure state spending and nine measure performance. Across the country overall, seven of the nine performance categories improved: Rural Interstate Pavement Condition, Rural Arterial Pavement Condition, Urban Arterial Pavement Condition, Structurally Deficient Bridges, Fatality Rate, Rural Fatality Rate, and Urban Fatality Rate. The two performance categories where conditions worsened: Urban Interstate Pavement Condition and Urbanized Area Congestion. Unfortunately, this increase in system performance comes at a substantial cost. Capital and Bridge Disbursements increased by 8 percent, Maintenance Disbursements by 14 percent, Administrative Disbursements by 8 percent, with Total Disbursements up by 9 percent.

For this newsletter’s audience, it’s particularly important to note that the report is a measurement of the roadways that each state owns and operates, not a ranking of the state departments of transportation. We also made one methodological change in this year’s report worth noting. Instead of calculating disbursement rankings using lane-miles, we used an average of centerline-miles, lane-miles, and vehicle-miles traveled per lane-mile. Centerline-miles are the length of the highway system (a five-mile road equals five centerline-miles). Lane-miles are the length of the highway system multiplied by the number of lanes on a highway (a five-mile road with two lanes equals 10 lane-miles while a five-mile road with six lanes equals 30 lane-miles). Vehicle-miles traveled per lane-mile are the total amount of miles traveled on the state highway system divided by the lane-miles in the state (100,000 vehicle-miles traveled per year divided by 200 lane-miles of roadway equals 500 vehicle-miles traveled per lane). We made this change in an ongoing effort to be fairer to all the states. While a centerline-miles ranking may favor rural, less-populated states, a vehicle-miles traveled per lane-mile ranking may favor urban, more-populated states. Therefore, we believe a composite measure can help provide a more accurate, richer dataset.

Generally speaking, this change had a modest effect on the report’s overall rankings. Eleven states saw a movement of 10 positions or more in the rankings. Arkansas, Mississippi, Wisconsin, South Carolina, and Iowa improved dramatically in the overall rankings—by 23, 17, 16, 14, and 11 positions, respectively. In contrast, Wyoming, Maine, Virginia, West Virginia, Oregon, and Vermont saw their rankings worsen by 25, 21, 19, 17, 16, and 11 positions, respectively.

For the past three editions of the Annual Highway Report, North Dakota has been the top-performing state in the study’s overall performance and cost-effectiveness rankings. But the state’s overall ranking is not a function of placing number one in any particular category. Rather, North Dakota ranks first overall because it scores in the top 30 in nearly all—12 of the report’s 13—categories. And it ranks in the bottom 10 states in only one category—Structurally Deficient Bridges. Its next-worst rankings are 28th in Urban Arterial Pavement Condition and in Rural Fatality Rate. Solid performance in nearly every category is what drives North Dakota’s overall ranking.

A far more-populous state, Missouri, ranks second overall in the report. Missouri also benefits from consistency across the board. Missouri does not rank in the bottom 10 in any of the 13 categories. Its worst ranking is 33rd in Structurally Deficient Bridges. Missouri shows that a more highly populated state (18th largest), with a large state highway system (7th largest by mileage), can rank highly in the report’s overall rankings and can serve as a model for other large states looking at lower rankings.

The worst-performing state is once again New Jersey, which ranks well in only two categories. The state ranks 3rd in Overall Fatality Rate and 4th in Rural Fatality Rate. But New Jersey is last in the overall rankings because of its poor performance in a large number of categories. The state has the highest Total Disbursements, Capital/Bridge Disbursements per Mile, and Maintenance Disbursements per Mile. It also ranks in the bottom five in Administrative Disbursements Per Mile and Rural Arterial Pavement Condition. In short, New Jersey spends far more money on its roads than the average state for a small state highway system that performs worse than average.

We frequently hear that it is unrealistic for New Jersey to have the same performance as North Dakota. But states such as New Jersey could focus on improving pavement conditions and reducing traffic congestion. It ranks in the bottom 10 in three different pavement condition categories, for example. Improving pavement conditions would help its rankings. Or, New Jersey could choose to focus on efficiency and reducing its spending somewhat, which would also significantly help its rankings. Reducing the state’s per-mile expenditures to levels that are comparable with states with similar geographic characteristics, such as Maryland, would help.

While it may be unrealistic for the worst-performing states to become top-ranked states quickly, they can make tangible progress on road conditions, deficient bridges, traffic congestion, and improve in ways that take them closer to average performance- and spending-levels for similar states.

States that rank poorly can also learn from other nearby states. Each state has strengths and weaknesses. For example, Georgia has long been an expert at maintaining high-quality urban Interstate pavement at an affordable cost. In contrast, Arkansas struggles at maintaining high-quality pavement. Thus, Arkansas officials might consider looking at the rankings and speaking with Georgia’s transportation officials about how they maintain their pavement quality. Transportation departments can use the report to see which states are succeeding in various categories and take the best practices from a variety of places.

Posted in Government Reform | Comments Off on Annual Highway Report Analyzes State Highway Systems’ Performance: Virginia Drops To 21

That $900 Billion Stimulus Package includes Pork – lots of it!

Share this article on:

Congress has passed, and the President has signed, the $900 billion stimulus package. There’s a lot of pork in the bill, and it includes USDA.

What is your tax dollar going to support?

About $10 million will be made available for gender programs in Pakistan. There will also be a study of the Springfield, Ill., race riots of 1908. There is also funding for studying the succession or reincarnation of the Dalai Lama. There is even money for a commission tasked with educating consumers about the dangers associated with using or storing portable fuel containers for flammable liquids near an open flame. 

There’s more: $130 million for Nepal, $453 million for Ukraine, and $700 million to our great allies in Sudan.

What about USDA? 

But let us examine what USDA received. Title I of the Consolidated Appropriations Act, 2021, starts with agriculture and rural development. Under Division A of the bill, there is a Title for the following agricultural programs: farm production and conservation programs; rural development programs; domestic food programs; and foreign assistance and related programs. There is a title for related agency and food and drug administration, and finally there is a Title VII for general provisions. There is even a Title XII for horseracing integrity and safety.

The Office of the Secretary of Agriculture is given approximately $47 million of which he is to spend approximately $5 million. Twenty-one million goes to the Assistant Secretary for Administration.

The language in the bill is enough to make your head spin. For example, the Chief Economist of USDA receives approximately $24 million. Of that, $8 million must go to grants and cooperatives for policy research. The lawyers, of course, are not left out because the USDA Office of Hearings and Appeals receives $15,394,000. The Chief Information Officer of USDA’s office receives approximately $67 million “…of which not less than $56,000,00 is for cyber security requirements of the department.”   

The Civil Rights Office of USDA receives approximately $23 million and to maintain the department’s buildings across the country, $108,124,000. USDA apparently has a number of hazardous waste sites and the legislation provides $6,514,000 to deal with this issue.

To protect all the bureaucrats in federal buildings, Congress sets aside approximately $23 million to the Office of Safety and Security, to make sure farmers and ranchers have identification papers to get into USDA buildings. The Office of Inspector General has approximately $100,000,000 to make sure all our USDA funds are spent appropriately. There is even $125,000 for paying confidential informants. In USDA there is even an Office of Ethics, and it receives $4,185,000.

The National Agricultural Statistical Service receives approximately $184 million. This money is used to send confidential surveys to you.

Research gets big bucks

The Agricultural Research Service (ARS) starts spending real money. Approximately $1.5 billion goes to the ARS and in addition, the ARS receives approximately $36 million to buy land or construct or repair buildings. 

The National Institute of Food in Agriculture also receives for research and other expenses $992,642,000. Another $11,880,000 is spent on Native American Institutions Endowment Fund. Extension activities which include the District of Columbia, Puerto Rico, Guam, the Virgin Islands, Micronesia, the Northern Marianas, and American Samoa are allocated $538,447.

I suspect many of you are not aware of the extension activities involving these areas.

Another program popular with American farmers and ranchers is the Agricultural Marketing Service (AMS). AMS receives the tidy sum of $188,358,000. Of course, AMS may collect fees pursuant to another statute. Of course, Congress claims USDA cannot collect more than $55 million. 

Another favorite agency is the Natural Resources Conservation Service (NRCS). NRCS helps conserve soil and water and acquires some lands and water. It also operates and maintains aircraft for which only $832,727,000 is made available. Out of this $832 million, $175 million must be spent on watershed protection and flood prevention. 

I will not get into the Federal Crop Insurance Fund or the Commodity Credit Corporation Fund in this column. As you can see, Congress has no problem spending money on agriculture – or gender studies in Pakistan.

This commentary originally appeared on December 28, 2020 in the online Farm Futures.

Posted in Agriculture, Economic Development, Economy | Comments Off on That $900 Billion Stimulus Package includes Pork – lots of it!

Does a $9 Billion Carbon Tax Get Your Attention?

Share this article on:


The 2021 General Assembly is now six weeks away, with the holidays in between. We know no more about the coming Northam Administration proposal to impose a carbon tax and rationing scheme on our motor fuels than we did months ago. Keeping you uninformed may be part of the plan.

All we have is the Transportation and Climate Initiative organization’s own data and modeling, which are quite extensive.

The initial added tax per gallon of gasoline in Virginia could range from 17.5 cents to 28 cents per gallon, depending on which of the 25% reduction scenarios the still-unseen TCI memorandum of understanding uses. By 2032 the tax could range between 36 cents and 57 cents per gallon, TCI projects.

TCI modelers looked at three possible ten-year CO2 reduction goals (20%, 22% or 25%), and three possible combinations of spending plans for the resulting tens of billions of collected carbon tax dollars. One policy design spends most heavily on electric and low-emission vehicle subsidies, and other plans put more money towards mass transit and bike trails.

TCI’s model for a 25% reduction goal under one of the scenario options, showing carbon taxes of $22 up to $46 per ton and revenue of $65 billion over 10 years (2017 $).

You can find the nine variations here under “TCI Policy Cases.” I’ve posted one as an illustration. This Excel page is based on the 25% reduction goal. If you think CO2 is that dangerous a substance, why settle for the lower reduction target?

The different policy cases drive different carbon tax amounts per ton, from $17.90 to $28.49 for 2022. The carbon prices seem to be based on short tons, or 2,000 pounds, of CO2. It takes about 102 gallons of gasoline to emit a short ton of CO2, so the price per ton is merely divided by 102 to get the price per gallon.

The new taxes result in major revenue hauls in the 12 states and the District of Columbia. How much would come to Virginia is also a still unknown, but Virginia represents about 11% of the population within the region. If 11% of the tax hits Virginia, the initial carbon tax on Virginia drivers and businesses ranges from about $500 to $810 million in 2022. By 2032 under the most expensive scenario it may reach $1 billion.

That most expensive scenario, TCI projects, collects about $82 billion in taxes over the first ten years. That could be more than $9 billion from Virginians, close to $1,000 per capita. The middle scenario, the one illustrated above, would cost Virginians $7 billion over ten years. And those are in constant 2017 dollars (noted clearly on the table), meaning the current dollar cost will be far higher.

Again, these are not my numbers. They are their numbers from those case studies. If they have different numbers for their final proposal, they should show them now. At this point the best argument to reject the coming memorandum of understanding is it was held secret too long. But this may be played out just like last year’s Virginia Clean Economy Act, when the real bill didn’t appear until the last minute, and legislators can complain “I didn’t understand it!”

Odds are strong the carbon tax dollars will not be the focus as the Virginia League of Conservation Voters holds a web seminar next week on “Protecting Health Through Transportation” to “discuss the next big climate fight – decarbonizing the transportation sector.” Register for their December 8 program here.

“Panelists will be updating us on the recent findings surrounding the public health burden of pollution and how this disproportionately affects many communities. We’ll also hear about what we need to do in 2021 to address these issues including transitioning to electric vehicles, pushing for better public transportation infrastructure, and Virginia’s potential to switch to California Clean Car Standards.”

In a post a few weeks back it was noted that the Virginia Division of Motor Vehicles’ website was not transparent about the current fuel taxes in Virginia. In response, it is clearer now (thank you, DMV). The three elements of state tax you now pay on each gallon are listed together, but not totaled to report their combined cost. The retail tax, wholesale tax and a third tax to cover the tank inspection program add up to 29.4 cents per gallon. It is 28.5 cents per gallon on diesel.

Next July, that will go up to 34.4 cents per gallon on gasoline, as already dictated by the 2020 legislature. How much would membership in the Transportation and Climate Initiative compact add to that starting in January 2022? Nothing, if the General Assembly is wise enough to take a pass on putting that new burden on Virginians.

Regular readers will remember that the Northam Administration’s 2020 transportation tax package did not spark opposition from me or from the Thomas Jefferson Institute for Public Policy. I’ve been advocating that “cents-per-gallon” tax approach for decades and have also advocated for regular adjustments to keep up with inflation.

This carbon tax is different and should be rejected.

A version of this commentary originally appeared on December 3, 2020 in the online Bacon’s Rebellion blog.

Posted in Taxes | Tagged | 5 Comments

Don’t Let the Left “Steal” the General Assembly

Share this article on:

Would you like to keep Virginia from drawing legislative districts skewed in favor of the Democrats — that is, prevent liberal gerrymandering? One way to fight such gerrymandering is to apply to be a citizen member of the Virginia Redistricting Commission, which will draw the boundaries of Virginia’s Congressional and state legislative districts. Virginia voters recently created the Commission in a state referendum, by passing a ballot initiative that was intended to prevent gerrymandering.

Applications can be submitted now and until just after Christmas. The application forms have just been posted on the Virginia Division of Legislative Services website and in order to be considered for selection as one of the eight citizen members of the Commission, you must submit an application by December 28. Three letters of recommendation are required to be submitted with each application.

Applicants must have been registered to vote in Virginia for the last three years and voted in two of the last three General Elections. Eligible applicants must not have ever held or run for partisan or political office, have been a lobbyist for the last five years, or have ever worked for the General Assembly or United States Congress. Career government employees are eligible.

If you don’t apply, or get fellow conservatives or non-progressives to apply, the redistricting commission may end up being dominated by progressives. That’s what happened in Arizona. Its redistricting commission ended up being effectively controlled by progressives, resulting in its Congressional districts being skewed in favor of Democrats.

Far from being neutral between the two political parties, Arizona’s “independent” redistricting commission proved to be a reliable ally of the Democratic party. For example, the commission gave Democratic votes more weight than Republican votes by packing more people into Republican-leaning districts than Democratic-leaning districts. At a time when Arizona was a mostly Republican state, and Republicans easily carried Arizona in presidential and U.S. senate elections, Arizona’s redistricting commission managed to draw Congressional districts for the U.S. House of Representatives in a way that resulted in five of Arizona’s nine representatives being Democrats. Truly random, nonpartisan redistricting would have led to fewer Democratic representatives in Arizona, especially given how Democratic voters tend to be heavily concentrated in urban areas (as polling expert Nate Silver has explained).

And as Chief Justice Roberts noted in a Supreme Court case,

The facts described in a recent opinion by a three-judge District Court detail the partisanship that has affected the [Arizona] Commission on issues ranging from staffing decisions to drawing the district lines. … The per curiam opinion explained that “partisanship played some role in the design of the map,” that “some of the commissioners were motivated in part in some of the linedrawing decisions by a desire to improve Democratic prospects in the affected districts,” and that the Commission retained a mapping consultant that “had worked for Democratic, independent, and nonpartisan campaigns, but no Republican campaigns.

If you have questions about the application process, or what information would be helpful to effectively serve on the commission, please email me with any questions at hfb138@yahoo.com (if you give me your phone number, I can discuss it with you by phone if you prefer).

A version of this commentary originally appeared on December 5, 2020 in the online Liberty Unyielding blog.

Posted in Politics | Comments Off on Don’t Let the Left “Steal” the General Assembly

Will Virginia Reject American Federalism?

Share this article on:

During the 1788 New York ratification convention, anti-federalists opposed the new Constitution “for lack of a Bill of Rights”. Alexander Hamilton replied, “The Constitution is itself in every rational sense, and to every useful purpose, A BILL OF RIGHTS” (Federalist #84). Indeed, it was written to safeguard liberty against the worst form of tyranny, the tyranny of the majority about which Plato, Aristotle, and Montesquieu warned, as did Tocqueville five decades later.

The American Left (no longer worthy of the term “liberal”) has always chaffed against the Founders’’ “checks and balances” within Madison’s “compound republic” (Federalist #51). If the mission of the Left can be summarized, it is “Tear down every rafter in the Constitutional edifice until all the protections for minority rights and diversity of regions and political thought are gone.”

In 2006 wealthy Californians launched a cynical attempt to remove one of the load bearing pillars of our Constitution – the Electoral College – by way of a National Popular Vote Interstate Compact. They aim to convince state legislatures to enact their Compact until states representing 270 Electoral College votes sign on, the number needed to elect a President. Already 15 entirely “blue” states have enacted the Compact for a total of 196 Electoral votes. Now those Californians have convinced Sen. Adam Ebbin (D) and Del. Mark Levine (D) to advance their model legislation in the January 2021 legislative session in Richmond. There are five major reasons why this legislation must be defeated:

NPV COMPACT: A CONSTITUTIONAL ASSAULT

The NPV Compact is a Constitutional assault on three fronts. First, the State Compact Clause (Article I) reads “No state shall, without the consent of Congress, enter into any Compact with another state…” The NPV cabal has not sought Congressional approval for their illicit state Compact. Second, the NPV cabal has not attempted to use the Constitution’s amendment process to achieve their goal as they know 38 states will never agree to this radical change to how we elect our Presidents. Third, the Framers considered three other ways to elect our President – election by Congress, by state governors, and by a national popular vote. All three were rejected for an Electoral College, what is today a Presidential election in each of our 50 states. Once agreed in Philadelphia, 13 state ratifying conventions voted to adopt our Constitution as written, including an agreed amendment process. The manner of electing our President was a keystone in the document’s architecture, one that must not be altered absent agreement with the requisite 38 states. It was the states that created our Constitution, the Constitution did not create the states.

NPV COMPACT: CONTRARY TO THEIR OATH’S “SACRED PROMISE”

The dictionary defines an oath as “A solemn promise, often invoking a divine witness, regarding one’s future actions or behavior.” Members of the Virginia legislature and the Governor affirm this oath of office: “I do solemnly swear I will support the Constitution of the United States, and the Constitution of the Commonwealth of Virginia… to the best of my ability, so help me God.” The NPV Compact is an un-Constitutional state compact (its name alone confirms this), a cynical attempt to change the Constitution without the votes of 38 states.

Moreover, the Commonwealth Constitution provides that only Virginia residents are entitled to vote for Virginia’s elected officials. Yet the NPV Compact would mandate turning the votes of Virginians over to the voters of other states to decide for whom Virginia’s 13 Presidential Electors will cast their votes! Can Virginia legislators who support the NPV Compact legislation tell the citizens who elected them that they are living up to their oath of office?

NPV COMPACT: AN AFRONT TO THOSE THEY REPRESENT

A Virginia legislator or Governor who supports the NPV Compact defies the Constitution and offers a civic afront to the citizens of our state. They are saying, “Regardless of how the majority of Virginians vote, I favor allowing citizens of larger states to decide how our Electors shall vote – none of whom elected me, none of whom pay my salary, and to none of whom have I given an oath of office.”

NPV COMPACT: ONLY NORTHERN VIRGINIA WILL MATTER

The population of “Northern Virginia” has exploded along with the US government and the high-tech industry. Today NoVA accounts for 67% of the state’s population! If the NPV Compact were in place, future Presidential candidates would only visit major metropolises like New York, Miami, Houston, Chicago, LA County… and the DC metro area. Virginia legislators who favor the NPV Compact are saying to the rest of the state – “You will no longer matter.” Will downstate legislators and the Governor support this unlawful Compact and then explain this additional afront to those who elected them and pay their salaries?

NPV COMPACT: A FEDERAL GOVERNMENT TAKE-OVER OF PRESIDENTIAL ELECTIONS

In 2020 the vastly different and swiftly changing elections laws of our 50 states have whipsawed our national elections. Over 30 states require photo IDs to vote, the rest do not. Until 2020 only seven state had 100% mail-in voting, now officials are finding boxes full of ballots all over the place and recounts abound! With Covid we saw 44 states change their voting laws and systems, often without public hearings. We are now witnessing the bitter harvest of election dysfunctions. Too many Americans today no longer feel that our elections are “fair and transparent”. This is a real threat to our ability to govern ourselves with good will and a sense of democratic justice.

Along comes the NPV Compact to heap upon our civic environment even more disruption and cynicism. It says, “regardless of how your state votes, those states with the most voters will forever rule this Nation.” Nine US states are home to 50% of our citizens. LA County has more people than 41 of our states! The “national popular vote” scheme aims to turn farmers and rural Americans into modern day serfs, feeding the major cities who will forever rule them. Gone will be the quaint Iowa Caucuses and New Hampshire Primaries. Want to alienate Americans more than they are now in this republic? Support the NPV Compact! And with all of the differences among our 50 state voting systems, the NPV Compact will naturally lead to calls to “nationalize our election laws” by placing the US government in charge of the voting systems of our 50 states. In turn, this will place a future American President in charge of their own re-election machinery. Stunningly unwise!

Yes, the Left seeks to take down the US Constitution, pillar-by-pillar. And they understand that taking down the Electoral College is actually the swiftest way to take down the entire Republic.

Posted in State Government | Comments Off on Will Virginia Reject American Federalism?