What are perennial, intermittent and ephemeral streams?

Share this article on:


In an earlier blog, I discussed what is “not” a water of the United States. The issue is trickier when a new definition of Waters of the United States (WOTUS) is examined for perennial, intermittent, or ephemeral streams.

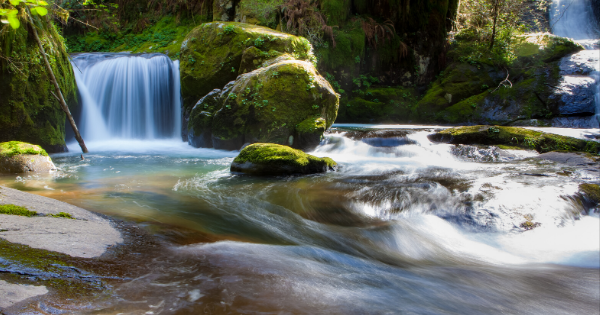
A perennial stream is defined “…to mean surface water flowing continuously year-round.” An intermittent stream in the WOTUS rule means “…surface water flowing continuously during certain times of the year and more than in direct response to precipitation.” This term is very tricky and may mean you have jurisdiction by EPA and/or by the Corps of Engineers or you may not. Intermittent generally means a seasonal situation when the groundwater table may be elevated. The Trump administration’s EPA even discusses melting snow as a sole or primary source of intermittent flow. The last term that is not as tricky legally as intermittent is the definition of ephemeral flow. Generally speaking, ephemeral flow is the result of precipitation. Ephemeral flow “…may occur simply because it is raining or has very recently rained or it has recently snowed and the snow has melted.”

You may have read of farmers and ranchers being subjected to lawsuits in the West because on occasion there was water in a streambed. The new WOTUS rule will not give government agencies jurisdiction over these brief storm events. Consequently, if a stream in the more arid portions of the country flows only in direct response to a rainfall then chances are this stream is ephemeral in nature and not subject to jurisdiction.

Rapanos plurality decision in promulgating the three terms. The U.S. Supreme Court plurality attempted to describe what it believed to be a Water of the United States. The plurality said “…a relatively permanent body of water connected to traditional interstate navigable waters.” EPA and the Corps of Engineers have attempted to clarify what is or is not a relatively permanent body of water.

Under the Obama administration’s earlier proposal, virtually any stream bed carrying water anytime of the year put that stream on your property under the jurisdiction of EPA and the Corps of Engineers. This act alone, as pointed out in earlier blogs, was an enormous grab of power against all landowners. You may remember candidate Trump made WOTUS one of his campaign themes.

What the new WOTUS rule attempts to be saying is that if the stream has dry channels and occasional puddles then a farmer or rancher has an ephemeral flow which would be excluded from WOTUS jurisdiction. Even though the Trump administration agencies have attempted to make WOTUS simpler, they have, I am afraid, created many lawsuits for the future.

A version of this commentary appeared on July 16, 2020 in the online Farm Futures. The opinions of the author are not necessarily those of Farm Futures or Farm Progress. 

Posted in Agriculture, Environment | Comments Off on What are perennial, intermittent and ephemeral streams?

Time to Take the Lead on Education Reform

Share this article on:

To say our country is experiencing difficult times is an understatement: COVID 19, protests, riots, death, and destruction. Are we in trying times or what? However, with any disruption to a routine, there’s opportunity. I believe this is an opportunity to seize the moment for ensuring real, significant education reform occurs.

With each new administration (federal, state, local) comes change. With any new rising star, an agenda for change is touted. Lasting change will require proposed legislation; hence consideration must be given to who controls the state, both executive and legislative, because this is where reform will take place. This is the level at which government will determine how the education system looks and operates in the future.

One may ask, “What reforms should be considered?” There are several, but the first reform that comes to mind centers around expansion of online education. Since the virus forced many schools, public and private, to implement some semblance of online access, this is the perfect time for entrepreneurs to develop curriculum for online platforms or start a new program. There are some great programs already in existence such as K12, Connections Academy, Khan Academy, Alpha Omega Academy, and Freedom Project Academy. I’m aware of a new program, iLumenEd Academy in Virginia, which will be starting this fall. There are many choices to consider depending on individuals desired focus and interests. Also, location is not a barrier to online learning.

Another reform is to consolidate various programs across divisions. What do I mean by this? The Merriam-Webster online definition includes: “to join together into one whole.” Take the wealthier, more populated divisions such as Fairfax County and Virginia Beach. These divisions are able to offer a greater variety of programs because they have the population and tax base. Conversely, less populated, more rural divisions in Virginia have limited similar or like programs. This is where an opportunity arises to consolidate programs, such as career and technical education (CTE), by designating a specific location as a regional school for children in adjoining divisions. In essence, this is equivalent to applying for a district transfer or to a Governor’s School such as in Roanoke or Lynchburg. Currently, Virginia has 19 academic-year Governor’s Schools as well as various summer programs. Based on population, shared costs, geography, and business opportunity, CTE regional offerings make sense. The 2016-2017 state data identifies 40,515 students completed CTE programs out of a student population of 1,288,033 or 3.1%. Virginia can do better for students and the economy. Now is the time to expand regional CTE schools where choice is restricted.

Expand Charter Schools throughout the state. The Virginia General Assembly passed legislation that authorized the creation of charter schools in 1998. Currently, there are eight operating in the state. Many may not be aware, but charter schools are part of the public education system and operate under a charter that is reviewed by the VBOE and approved by the local school board. These schools offer mandatory courses, but have the flexibility to provide specific curriculum based on the purpose. Many offer a college prep curriculum, while other may focus on the arts, special education, technology, or CTE. Neighboring states, such as Maryland has 46 and North Carolina has 184. This is a far cry from charter opportunities afforded children in Virginia. However, expansion in Virginia will require rethinking the application process to ensure divisions and the state work with, not against, the applicants.

Lastly, let’s put in place reforms that hold persons in authority accountable and responsible for their actions. There is much focus around reforming the police system to allow the bad apples to be fired, based on performance and the actions they display on the job. I advocate that similar standards should be put in place and applied to those in the education system. As a former local school board member, I’m aware of employees that have been publically called out for engaging in inappropriate behavior, not performing their duties, or are legally charged with a civil or criminal violation. Over the years there have been officials in various states caught embezzling public funds and inflating test scores. When caught, it’s not typically the first time they’ve participated in this behavior and should not be allowed to resign. In some cases, unions shield them from being removed. This is an affront to all the employees that do what is right, follow the rules, and try their best to help students learn. However, I believe they must be fired, lose their position and license, and not be hired in another division, which only serves to allow them to perpetuate their behavior. In the documentary, Waiting for Superman, the shuffling of employees between schools and divisions is referred to as the dance of the lemons. This should not be allowed or tolerated.

I realize there are many who will think some of these suggestions are extreme, unrealistic, or even down right impossible to consider. However, since we seem to be in a time period that is loudly screaming for change, this is the time to think and believe all things are possible. Let that entrepreneurial spirit rear it’s head and create new and better tools, techniques, and methods for ensuring what state constitutions claim: a quality education for all.

Families should expect safety in whatever institution they choose for their child. It’s presumed the learning environment will support their child’s innate talents and skills. Parents must hold authorities accountable through ensuring appropriate norms are being enforced. Let’s seize the moment! Let’s take a stand! Help those who are voiceless find their voice.

Posted in Education, Government Reform | Comments Off on Time to Take the Lead on Education Reform

Something for Everyone in COVID Money Flood

Share this article on:

Will $50 million be enough? Will that get all the Virginians who have fallen behind due to COVID-19 square on their rent or mortgage payments?  Or is that amount, in a new relief program detailed Monday by the Northam Administration, merely a start?

There is a hint on the program’s web page. “Financial assistance is a one-time payment with opportunity for renewal based on availability of funding and the household’s need for additional assistance and continued eligibility.”  Of course, it is just a start.  A Senate committee was told last week that Governor Ralph Northam is considering spending hundreds of millions more for the same purpose.

Why not?  The flood of COVID-19 relief money from Washington continues, with applicants lining up for their share.  Within the more than $28 billion directed to Virginia in just a matter of months, the money to help with late rent and mortgage payment constitutes a rounding error.  Much of the rest is going to businesses or individuals with far less need.

The Virginia Senate Finance and Appropriations Committee met virtually on June 23 to be briefed, among other things, on how the four waves of federal assistance have been or will be spent.  The meeting was not reported at the time, but was recorded, and the presentations are online.

Secretary of Finance Aubrey Layne, in his presentation, estimated that Virginia has received more than $28 billion in direct aid – $6.5 billion direct to the state and local governments, $14.4 billion to state businesses in the Payroll Protection Program and $7.3 billion pledged to municipal liquidity facility loans to cover revenue losses. 

That does not, repeat not, include the funds flowing to individuals through the supplemental unemployment insurance payments (that extra $600 per week) and the billions paid out in those individual stimulus checks to federal taxpayers. The unemployment bonus alone may exceed $1 billion per month feeding Virginia’s economy.

In all, Layne estimated, the four bills which have passed Congress (so far) created 79 distinct paths for money to flow to the Commonwealth, its localities, its businesses, and its citizens. The most important to the state budget was an increase in the federal share of the cost of Medicaid, saving the state’s General Fund $650 million this year and next. Another $644 million has already been shared with local governments, not counting the $200 million Fairfax County got directly because of its size.

After all the state-level spending on emergency response, personal protective equipment, testing equipment and lab services and other direct costs of dealing with the disease, more than $2.2 billion remains unspent and presumably will carry into the new fiscal year
July 1.

In a separate presentation, the committee staff took 46 pages to detail all the ways the federal money is propping up the state, its localities, colleges and hospitals. It also provides a bit of historical context, contrasting the trillions spent nationally this year with $10 billion in grants to the states during the 2001 Dot Com recession and the $275 billion provided states during the Great Recession starting in 2008. This time, the big bucks (so far) have gone to businesses and individuals.

Virginia hospitals and other health care providers have received $1.7 billion to date, in two waves. Four hospitals hit hardest by COVID received $75 million, directly, with another $75 million to nine “safety net” hospitals. An additional distribution for Medicaid-only providers is pending this summer.

Despite all the money that has flowed out, the list of pending requests totals another $1.2 billion. The staff reported that the Department of Housing and Community Development wants a total of $235 million for rental and mortgage relief, homeless housing, and broadband expansion (so, indeed, $50 million is the down payment.)

In the early waves, $394 million was directed to Virginia colleges and universities.  Just one university, Virginia, has asked for $260 million more out of the remaining pot. Virginia Tech can get by with a mere $33 million more.  The Department of Social Services wants $171 million, “mainly for providing a stimulus benefit to immigrant families that are not eligible for social security numbers.”

The sugar high this has provided to the state’s economy so far, with the glucose drip right into the vein continuing into next year, explains why the state’s finances look far, far better than many expected. In fact, at one point in last week’s meeting, Senator Richard Saslaw, D-Fairfax, started pressing for an estimate on how much of the $2 billion frozen in the coming state budget could be released.  Layne demurred, but did not deny that much of the deferred spending may be restored.

This massive tsunami of federal largess, all borrowed from the future, far exceeds any precedents, like so much else that has happened in the past four months. It cannot continue. Yet it probably will. If you thought government spending would be among the COVID casualties, you were wrong. If you thought the Bernie Sanders utopian vision of society’s needs being met by unlimited federal spending died with his campaign, the pandemic brought it roaring back to life. 

Posted in Economy | Comments Off on Something for Everyone in COVID Money Flood

Working at Home and Implications for the Future Economy

Share this article on:
A computer on a cluttered desktop due to working at home

Working from home was already becoming more common, but the COVID-19 crisis forced many employers to quickly alter policies to enable more workers to perform their jobs from home.

This forced experimentation with remote work is causing some employers to alter their policies permanently.

Shopify, for example, announced in May that its 5,000 employees would be allowed to work from home indefinitely. Twitter’s CEO told workers in May that they can continue working from home “forever” even once the pandemic is over.

More employers following this example could cause a fundamental shift in demand for office space.

But not all work can be performed remotely.

Which occupations could be performed remotely? The American Time-Use Survey and the Occupational Information Network, or ONET, the database of occupational information developed under the U.S. Department of Labor, can shed some light.

The Time-Use Survey asks if respondents can work from home, if they actually have worked from home, and the reasons for working from home.

NET provides worker characteristics including the need to “… perform job tasks in close physical proximity to other people.” It also has information on other working conditions that would typically preclude working from home, such as working outdoors or in an enclosed vehicle or needing to spend working time standing or wearing safety equipment.

Combining the Time-Use Survey and ONET data, occupations can be classified into one of three buckets: remote jobs, partial-remote jobs and non-remote jobs.

About 12% of U.S. employment falls under remote job occupations, with 26% in the partial-remote bucket and the remaining 62% in non-remote occupations.

Remote jobs include occupations such as bookkeepers, software developers, lawyers and financial managers. Office clerks, personal care aids, and general operations managers top the list of partial-remote jobs. Non-remote jobs include retail salespersons, cashiers and registered nurses.

The 12% for remote job seems like a small number, but it could have significant implications for regions that have a relatively large amount of office space.

To measure the potential impact on metropolitan areas, let’s look at the industries with the highest concentrations of remote-work employment as defined by each industry’s component occupations. The top industries included software publishers, computer system design and legal services.

The resulting remote-work index compares the mix of remote-work employment in the region versus the mix in the nation.

An index of 100% means the region has the same mix as the nation. An index of 110% means the region has 10% more remote jobs than average for a region of its size and an index of 90% means the region has 10% less remote jobs than average.

Changing remote work conditions have significant implications for economic development, site selection and urban planning.

Employers shifting to remote work arrangements can drastically change the demand for office space.

Likewise, labor supply questions for some occupations need to be approached differently if commuting time becomes a less important factor.

If more people are working from home, shifts in daytime population will have ripple effects for both business districts and neighborhoods.

Based on the remote-work index, the top five metro areas with high concentrations of either tech or office employment:

  • San Jose-Sunnyvale-Santa Clara, Calif., with 145% index;
  • California-Lexington Park, Md., 134%;
  • Boulder, Colo., 131%;
  • Washington, D.C.-Arlington-Alexandria, 128%; and
  • San Francisco-Oakland-Berkeley, Calif., 126%.

Of metro areas with lower ratios of remote work jobs, some have high concentrations of tourism industries, others are heavy with agriculture, while others have large manufacturing sectors.

The bottom five are:

  • Elkhart-Goshen, Ind., with a 66% index;
  • Visalia, Calif., 66%;
  • Kokomo, Ind., 69%;
  • Ocean City, N.J., 69%; and
  • Madera, Calif., 69%.

The Richmond metro area remote-work index is 107%, ranking it No. 34 in the nation.

The tourism activity in Virginia Beach-Norfolk-Newport News region puts it at 95%, with a ranking of No. 115.

The coronavirus pandemic has reshaped our lives over the past few months. Some analysts are expecting reduced demand for traditional office space in the post-COVID era. Others point out the difficulties of onboarding new employees and creating a culture in a totally remote work environment.

The long-term effects remain to be seen as the direct coronavirus impact plays out and the responses of employers take hold in the post-COVID economy.

A version of this commentary originally appeared in the July 6, 2020 edition of The Richmond Times-Dispatch.

Posted in Economy | Comments Off on Working at Home and Implications for the Future Economy

New Data Shows Transit Is Changing

Share this article on:

Transit agencies are in crisis mode. The Covid-19 pandemic and shelter-in-place orders across the country led to ridership declines of up to 95%. But even before this crisis, transit agencies were losing ridership.

Recently, the Center for Urban Transportation Research (CUTR) at the University of South Florida analyzed the transit trends in the 2017 National Household Travel Survey (NHTS). Every eight years the U.S. Department of Transportation conducts the NHTS, which analyzes trends in personal and household data. The biggest takeaway is that while many imagine the primary transit customers to be low-income minorities, the reality can be very different.

Some of the survey results are not surprising. Almost half of transit riders live in zero-vehicle households. More than 30% of riders live in one-car households. Vehicle access is a primary determinant of transit usage; households with one vehicle take 80% fewer transit trips than households with zero vehicles.

Most zero-vehicle households cannot afford a car. However, some of the zero-households choose not to have a vehicle. While these households are a fraction of all transit users, they have much higher incomes and are concentrated in transit legacy cities such as New York or Washington.

Between 2009 and 2017, the number of transit trips per capita fell among every age group, on average by 0.5, from 4 to 3.4 trips per day. At the same time, the average age of riders is increasing. The transit mode share increased in many age groups, particularly ages 36-65. Part of the increase is due to the average age of U.S. residents increasing from 36 to 38, but part is due to increased use by older residents.

White non-Hispanic residents make almost 40% of trips, an eight-percentage point increase from 2009. Meanwhile, black and Hispanic transit usage was down more than 5%. This trend is significant because the percentage of white non-Hispanic residents in the overall population continues to decline.

The average transit trip time increased 14% from 2009 to 2017 from 21 to 26 minutes. While the average wait time decreased, the in-vehicle time increased by almost six minutes. Part of this is increasing traffic congestion on city streets since many cities ignore the problem of traffic congestion. More traffic congestion makes bus trips slower and less reliable. But part of this increase is also a growth in rail trips, which tend to be longer distances.

Ride-hailing constitutes a small but growing share of all trips. In 2017, almost 3% of commuters chose ride-hailing, four times as many as chose cycling and twice as many as chose walking. And those numbers continued to increase between 2017 and 2019. Of those who chose transit, almost 30% ride-hailed at least once per week. This suggests that transit usage and ride-hailing can be complementary, and transit agencies that try to restrict ride-hailing might be alienating some customers.

However, the biggest takeaway from the NHTS is the diverging incomes between bus and rail riders, which are two very different demographic groups. Rail use is highest among riders earning $125,000 to $200,000 and lowest for riders earning $10,000 to $50,000. Bus use is highest among riders who make less than $35,000 and lowest for those who make $75,000 or more.

Almost 8% of commuters making less than $10,000 use buses. Less than 1% of commuters making less than $10,000 use rail. Less than 1% of commuters making $100,000 or more use buses. Middle-class customers (those in the 3rd quintile) use rail the least, making fewer than two billion trips. The wealthiest commuters (those in the 5th quintile) use transit more than working-class customers (those in the 2nd quintile) and middle-class customers (those in the 3rd quintile).

Clearly, transit use is bifurcated. And while bus riders have lower incomes than average, rail riders have much higher incomes. Geographic location also plays a significant part. Rail transit systems are more concentrated in expensive metro areas such as New York, Chicago, San Francisco, and Washington, DC. But even after you adjust for geography, the average transit customer is becoming older, whiter and wealthier.

Therefore, we need to rethink government funding of mass transit. The biggest justification for subsidizing transit is to provide low-income residents who can’t afford a car a safe, reliable trip to work. Without transit, these workers may not be able to access jobs, hurting their opportunities and increasing their potential need for social programs, such as welfare. But given that many rail users today are middle to upper income commuters, taxpayers should stop subsidizing these trips. Rail operators should charge these customers the full costs of providing the trip.

After verifying income, vouchers could be provided to low-income residents who use rail. Living car-free might make sense in parts of New York City or Washington, DC, but it should not involve a subsidy to the wealthy.

A version of this commentary originally appeared on June 4, 2020 in the online Surface Transportation Innovations Newsletter.

Posted in Government Reform, Transportation | 1 Comment