"We Were Encouraged to Make the Student Fail"

Share this article on:

maury_hs-150If you thought the scandal of the Alexandria school principal weeding out weak students from the Standards of Learning (SOL) exams was bad, you ain’t heard nothing yet. In a superb piece of investigative journalism, Cherise Newsome with theVirginian-Pilot has exposed SOL-gaming in Norfolk that was more grotesque by far.
To improve SOL testing scores, Norfolk educators yanked marginal students out of second-semester classes so they could repeat the first semester — and avoid taking the SOL. Educators justified the practice on the grounds that students needed the remedial teaching (which they undoubtedly did). But Katz uncovered plenty of evidence that school administrators were motivated by a desire to improve SOL scores.

Norfolk principals and senior administrators told The Pilot that no students were moved just to avoid testing, but one Lake Taylor High teacher disputes that. The teacher – along with one other and a former administrator at different schools who shared similar accounts – spoke on condition of anonymity because of fear of retribution.
The Lake Taylor teacher said educators were told to make sure there was a defensible reason for pulling kids out ahead of the exams, buying the school more time to improve its accreditation. Lake Taylor hasn’t been fully accredited since 2012-13.
“We were encouraged to make the student fail,” the teacher said. “So even if a student had a D-minus, we were told to make sure to give them something to bring them down a little bit, and don’t provide opportunities for them to make it up because you want them to remain failing so they can repeat first semester.”
Targeted students would take the second part of the SOL course during the following fall. So their schedules were out of order, and they didn’t remember what they had learned, the teacher said: “It didn’t fix any problems. It was just a bad solution.”
Claudia Sweeney, a former Lake Taylor High counselor who retired three years ago, backed up that account. Teachers feared for their jobs and did what they were told, she said. …
The Pilot interviewed a half-dozen students and parents who said the schedule changes put them behind on requirements and caused some to miss out on a standard diploma. The students, including some with special education plans and others who had been on an honors track, provided schedules and transcripts showing they took SOL classes out of order or repeated them.

The practice of “recycling” students does have a justification. As former Granby High School Principal Ted Daughtrey said: “We picked, targeted certain students with certain averages to come back to first-semester classes. … We’re talking about kids that can’t add or subtract positive numbers. They’re just very far behind. So to expect them to be successful in Algebra I in a year is a pipe dream.”
True enough, a child who cannot add or subtract positive numbers has no business taking an Algebra I class. But that begs the question: How did those children get promoted to the Algebra I class in the first place? Why wait to take remedial action until they reached a grade where they took the SOLs? And, if it’s the students the administrators care about, how does it help to enroll them in the second-semester class the following year?
Then Daughtrey spills the beans:

“The picture I’m trying to paint is, if we had left those kids in there like we had in the past, they would have penalized us, not because we weren’t working but because they weren’t coming to school and doing what they needed to do,” Daughtrey said.
When asked what he meant by “penalize us,” he said, “We might not have met the 70 percent pass rate for state accreditation.”

Bacon’s bottom line: Please note: There is nothing illegal with any of this. That’s the real scandal.
Moreover, I cannot imagine that Alexandria and Norfolk are the only school systems in Virginia where SOL gaming is going on. What’s the next shoe to drop? At what point do we recognize that we have an endemic problem, especially in schools with large numbers of disadvantaged, low-performing students? Whose interests are being served by the SOL gaming — those of the students or of the school administrators?
— Hat tip: John Butcher)
(This article first ran in Bacons Rebellion on September 12, 2016)
bacon-90Email this author

Posted in Education | Comments Off on "We Were Encouraged to Make the Student Fail"

More on the Driverless Cars

Share this article on:

driverless-carIn my first column titled “Why We Can’t Live Without Autonomous Vehicles” I shared a number of reasons why semi-autonomous and autonomous vehicles are being developed and why they will ultimately save us from ourselves.  In this column I’ll explain the basics on how autonomous technology works and how it is being further developed.
There are three main components to every autonomous vehicle; cameras, radar, and lasers which are also referred to as ‘LiDaR’, which stands for Light Detection and Ranging or as a portmanteau of “light” and “radar”.  
The cameras function as the eyes with two or even three cameras mounted to the front and rear of each vehicle.  Two cameras mounted a short distant apart allow them to judge distance, no different than the function of our own eyes.
Radar acts by sending out pulses of high-frequency electromagnetic waves that are reflected off the object back to the source. Radar helps collect information regarding the presence, direction, distance, and speed of an object.  
Lidar, which you’re probably the least familiar with, acts much like radar, but uses lasers instead of waves to measure distance by illuminating a target with a laser light.  Lidar systems can take more than 1 million separate readings per second.
Each of these detection technologies has different ranges and fields of view and each serves a different, yet redundant, purpose.   When the data collected by each of these individual components is combined, a detailed 3-D map is created that then allows the vehicles to navigate.  This data allows the vehicle to steer itself down a road or highway, change lanes, and adjusts speed in response to objects ahead or even traffic.
Another element of the autonomous vehicle is the computer inside it.  The vehicle you drive today has about the same functionality and memory as the computer you have at home or at work.  For autonomous vehicles, the computers need to be hundreds or even thousands of times more powerful to do all the processing, to merge all the information coming from the cameras, radar, and lidar.  How much data you ask? Intel has estimated that “by 2020, the average autonomous car will process upwards of 4,000 gigabytes of data per day, while the average internet user will process 1.5 gigabytes,” meaning that one single autonomous car will produce the same amount of data in a day as a 2,666 internet users.  Now do you understand why everyone is talking about investing in cloud computing?
All of the data processed by these sensors is then fed back via the cloud, in real time, to a central hub so that each of the other autonomous vehicles can learn from it.  This is called ‘fleet learning’ and it is being truly perfected by the folks at Tesla.  The data collected from each individual vehicle is then aggregated into maps that let the central hub see the precise paths the cars take and don’t take.  This information is then shared across the entire fleet of vehicles, so when one vehicle in the fleet travels down a particular road, they all in effect have traveled down that same road.  These cars are constantly learning, recording, and sharing where they do and don’t actually travel.
Fleet-learning exponentially increases the curve and capabilities of each individual vehicle.  As Elon Musk, the CEO of Tesla, said last month, “As more real-world miles accumulate and the software logic accounts for increasingly rare events, the probability of injury will keep decreasing.”  

Besides sharing real-time information through the cloud, autonomous vehicles will also have vehicle-to-vehicle (V2V) communication capabilities.  Transponders on each vehicle will broadcast to surrounding vehicles its speed, heading, and braking status to anyone or anything within a range of approximately 300 meters.  V2V technology has already advanced enough to where it can see around corners and convey a driver’s intent.  V2V communication alone might be the single most important tool to solving traffic congestion.  Don’t believe me?  Watch this quick video.
Lastly, you often hear autonomous cars classed by levels ranging from Level 1 to Level 4. Here is a quick explanation as handed National Highway Traffic Safety Administration:

  • Automation Levels
    • No-Automation (Level 0): The driver is in complete and sole control of the primary vehicle controls – brake, steering, throttle, and motive power – at all times.
    • Function-specific Automation (Level 1): Automation at this level involves one or more specific control functions. Examples include electronic stability control or pre-charged brakes, where the vehicle automatically assists with braking to enable the driver to regain control of the vehicle or stop faster than possible by acting alone.
    • Combined Function Automation (Level 2): This level involves automation of at least two primary control functions designed to work in unison to relieve the driver of control of those functions. An example of combined functions enabling a Level 2 system is adaptive cruise control in combination with lane centering.
    • Limited Self-Driving Automation (Level 3): (“hands off”) Vehicles at this level of automation enable the driver to cede full control of all safety-critical functions under certain traffic or environmental conditions and in those conditions to rely heavily on the vehicle to monitor for changes in those conditions requiring transition back to driver control. The driver is expected to be available for occasional control, but with sufficiently comfortable transition time. The Google car is an example of limited self-driving automation.
    • Full Self-Driving Automation (Level 4):< (“brain off”) The vehicle is designed to perform all safety-critical driving functions and monitor roadway conditions for an entire trip. Such a design anticipates that the driver will provide destination or navigation input, but is not expected to be available for control at any time during the trip. This includes both occupied and unoccupied vehicles. (not even the presence of a steering wheel or brake pedal)

Now that you’ve passed Autonomous Vehicles 101, in my next column we’ll start to expand greatly into the who, what, when, where and why behind the first Level 3 and Level 4 autonomous vehicles you’ll likely see on the road.  Hint: Commercial vehicles, 3-5yrs, everywhere, too profitable not too.
I’ll also dive into issues the local and state transportation policy, funding, major projects and where autonomous vehicles can and will deliver solutions.  Here in 2016 we celebrate the 60th Anniversary of President Eisenhower’s ‘Federal Aid Highway Act’, and since its inception in 1956, the nation’s focus has been all about building more and more roads.  That age based around our access to, and quantity of, roads is over, and a new era focused on simply the quality of our existing roads is now upon us.
Christopher West Profile pic-100E-Mail this Author

Posted in Transportation | Comments Off on More on the Driverless Cars

Confusion, Muddle, Obfuscation and More

Share this article on:

obama-in-china-150Winston Churchill called Russia a riddle wrapped in a mystery inside an enigma. We could say Obama’s energy and climate policy is confusion wrapped in muddled thinking inside obfuscation – and driven by autocratic diktats that bring job-killing, economy-strangling, racist and deadly outcomes.
President Obama was recently in China, where his arrival turned into an inglorious snub, when he had to use Air Force 1’s rear exit. He was there mostly to join Chinese President Xi Jinping and UN Secretary Ban Ki-moon, to formally sign the Paris climate treaty that Mr. Obama insists is not a treaty (and thus does not require Senate “advice and consent” under Article II, Section 2 of the Constitution) because it is not binding – yet.
However, once it has been “signed and delivered” by 55 nations representing 55% of global greenhouse gas emissions, it will be hailed as binding. China and the US alone represent 38% of total emissions, so adding a few more big nations (Argentina, Brazil, India, Indonesia, Japan and Germany, eg) would reach the emission threshold. Adding a bunch of countries that merely want their “fair share” of the billions of dollars in annual climate “adaptation, mitigation and reparation” cash would hit the country minimum.
Few if any developing nations will reduce their oil, natural gas or coal use anytime soon. That would be economic and political suicide. In fact, China and India plan to build some 1,600 new coal-fired power plants by 2030, Japan 43, Turkey 80, Poland a dozen, and the list goes on and on, around the globe.
Meanwhile, the United States is shutting down its coal-fueled units. Under Obama’s treaty, the USA will be required to go even further, slashing its carbon dioxide emissions by 28% below 2005 levels by 2025. That will unleash energy, economic and environmental impacts far beyond what the Administration’s endless, baseless climate decrees are already imposing.
Federal agencies constantly harp on wildly exaggerated and fabricated “social costs of carbon” – but completely and deliberately ignore the incredible benefits of carbon-based energy.
The battle is now shifting to natural gas – methane. Hillary Clinton and Democrats promise to regulate drilling and fracking into oblivion on federal lands. California regulators are targeting cow flatulence!
EPA continues to expand ethanol requirements, even though this fuel additive reduces mileage, damages small engines, uses acreage equivalent to Iowa, requires enormous amounts of water, fertilizer, pesticides, gasoline, methane and diesel fuel – and releases more carbon dioxide into the atmosphere than it removes.
Wind turbines, photovoltaic solar arrays and their interminable transmission lines already blanket millions of acres of farmland and wildlife habitats. They kill millions of birds and bats (but are exempt from endangered species laws), to provide expensive, subsidized, unreliable electricity. Expanding wind, solar and biofuel programs to reach the 28% CO2 reduction target would increase these impacts exponentially.
But all this is necessary, we’re told, to prevent climate cataclysms, like an Arctic meltdown. “Reports from fishermen, seal hunters and explorers all point to a radical change in climate conditions and hitherto unheard-of temperatures in the Arctic zone,” the Washington Post reported. Icebergs are becoming scarcer, in some places seals are finding the water too hot, and within a few years rising seas “will make most coastal cities uninhabitable.” The situation could hardly be more dire. Oh, wait. My mistake.
That was in November 1922! Recent warming and cooling episodes are not so unprecedented, after all.
However, all this climate confusion, obfuscation, fabrication and prevarication are merely prelude, a sideshow. The real issues here are eco-imperialism, racism and racially disparate impacts.
This racism is the sneaky, subtle, green variety: of government policies that inflict their worst impacts on the poorest among us, huge numbers of them minorities – while insisting that the gravest risks those families face are from climate change or barely detectable pollutants in their air and water.
In the Real World, soaring energy prices mean poor families cannot afford adequate heating and air conditioning, cannot save or afford proper nutrition, and must rely on schools, hospitals and businesses whose energy costs are also climbing – bringing higher prices, reduced services and lost jobs.
Workers who are laid off, dumped on welfare rolls or forced to take multiple lower-paying part-time jobs face greater stress and depression, reduced nutrition, sleep deprivation, greater alcohol, drug, spousal and child abuse, and higher suicide, stroke, heart attack and cancer rates. That means every life supposedly saved by anti-fossil fuel policies is offset by real lives lost due to government actions.
Unemployment among minorities, especially black teens, is already far higher than for the population at large. Crime and other inner city problems are far worse than elsewhere. Policies that further cripple economic growth, job creation and revenue generation will make their situation infinitely worse.
Of course, legislators, regulators, lobbyists, eco-activists, crony capitalists, judges and celebrities are rarely affected. Their communities are far from those that bear the brunt of their edicts, so they’re shielded from most impacts of policies they impose. They know what is happening, but are almost never held accountable for actions that are racist in their outcomes, if not in their supposed “good intentions.”
To them, a planet free from inflated, hypothetical dangers from modern technologies is more important than lives improved or saved by those technologies. In Earth’s poorest countries, the outcomes are lethal on a daily basis. There, billions live on a few dollars a day, rarely or never have electricity, and are wracked by joblessness, malnutrition, disease and despair. Millions die every year from malaria, lung infections, malnutrition, severe diarrhea, and countless other diseases of poverty and eco-imperialism.
And yet, President Obama, the UN, its Intergovernmental Panel on Climate Change, and myriad environmental pressure groups tell impoverished dark-skinned people they should rely on “clean energy strategies” to improve their lives, but not “too much,” since anything more would not be “sustainable.”
“If everybody has got a car and air conditioning and a big house,” Mr. Obama told South Africans, “the planet will boil over.” He can jet, live and golf all over the planet, but they must limit their aspirations.
Thus his Overseas Private Investment Corporation refused to support a gas-fired power plant in Ghana, and the United States “abstained” from supporting a World Bank loan for South Africa’s state-of-the-art Medupi coal-fired power plant. Meanwhile, radical environmentalist campaigns limit the ability of African and other nations to use DDT and insecticides to control malaria, dengue fever and Zika – or GMO seeds and even hybrid seeds and modern fertilizers to improve crop yields and nutrition.
No wonder Philippines President Rodrigo Duterte said his country will not ratify the Paris climate treaty. “Now that we’re developing, you will impose a limit? That’s absurd,” he snorted. He’s absolutely right.
These anti-technology campaigns are akin to denying chemotherapy to cancer patients. They result in racist eco-manslaughter and must no longer be tolerated – no matter how “caring” and “well-intended” supposed “climate cataclysm prevention” policies might be.
If we’re going to discuss race, racism, disparate impacts, black and all lives mattering, and protecting people and planet from manmade risks, let’s make sure all these topics become part of that discussion.

Email this author

Posted in Energy, Politics | Comments Off on Confusion, Muddle, Obfuscation and More

TPP Annex 2-D Tariff Commitments – Canada

Share this article on:

canadian_flag_2_by_merlin2525As I wrote time, the Trans Pacific Partnership (TPP) includes 30 chapters. Within Chapter 2 there is Annex 2-D which lists each country’s general notes relating to tariff schedules and provides a list of each country’s tariff elimination schedule.
Each country also lists, as Canada does, an appendix setting forth tariff rate quotas which allow only certain amounts of product entering a country.
Because Canada is a major trading partner, I reviewed the tariff schedule of Canada, its Appendix A – Tariff Rate Quotas (TRQ), and its 257-page Tariff Elimination Schedule. (Mind numbing.) The General Notes describe the elimination of customs duties and spell out categories where customs duties on originating goods “…shall be eliminated entirely, and these goods shall be duty-free on the date of entry into force of this Agreement for Canada.”
Canada also indicates there are certain goods which shall only be duty-free after four years, six years, seven years, 11 years, and 12 years. Canada and Japan have an agreement that they will consult within seven years after the agreement goes into effect “…with a view to increasing market access.”
The second Annex document for Canada is entitled “Tariff Elimination Schedule.” This schedule sets forth every item imported into Canada and describes the base rate or tariff on each product. It also indicates the tariff on the product or whether starting in year one the product comes into Canada and has a tariff levied on the product.
Lamb imported into Canada does not have a duty, with the exception of one category entitled “Of Mutton.” Presently there is a 2.5% tariff on mutton and that tariff disappears for the next 12 years.
Fowl play
For categories of fowl there are high tariffs per kilogram. The tariff rate schedule indicates that for several categories there are tariff rate quotas for the product. After the TRQ is met, in one case a $2.11 per kilogram tariff is applied. To be fair, TRQs do not appear to be too numerous.
Fish, cheese, honey, flower bulbs, shrubs, vegetables, corn, barley, wheat and hundreds of other products such as pig fat are listed in the schedule.
Wheat and barley present interesting facts. The wheat schedule is identified within the access commitment and over the access commitment. The category of wheat “within the access” presently has a 3.5% tariff. Wheat within this category, starting in year 1, is free from any tariff. Wheat in the “over access” category has a present tariff rate of $98.60/ton plus 7%. That amount is reduced to $89.63/ton in year one and by year 10, the tariff will be reduced to $9.68/ton and the 7% is reduced to 0.6%.
Corn, on the other hand, has a 5% tariff applied to it presently. When the TPP goes into effect, that tariff is eliminated immediately for the next 12 and subsequent years.
The third document in the Annex is entitled “Tariff Rate Quotas of Canada.” This section “…sets forth modifications to the Schedule to Canada’s Customs Tariff that reflect the tariff rate quotas (TRQs) Canada shall apply to certain originating goods under this Agreement.” This section certainly raises questions regarding the “fair deal” aspect of the TPP. The fine print in this section makes it clear that only certain quantities of product shall be permitted entry into Canada. Canada makes clear that its allocation of TRQs will be set each year and is applicable to the Canadian dairy, poultry and egg sector. This 25-page appendix describes TRQs for milk, which only allows 8,333 metric tons (MT) of milk into Canada for the first year. This amount is increased to 56,905 MTs and remains at that amount after year 19. Cream also has its own TRQ as does skim milk powders, cream powders, yogurt, and buttermilk. Cheeses of all types are permitted to enter Canada duty-free so long as they are under the specified TRQ as are ice cream and mixes.
Another category with a TRQ is broiler hatching eggs and chicks, turkeys, and eggs.
As one reads these lengthy and complicated documents it appears the results are headed in the right direction but slowly. Maybe too slowly!
(This article first ran in Farm Futures on Aug 22, 2016)
Email this author

Posted in Agriculture | Comments Off on TPP Annex 2-D Tariff Commitments – Canada

Energy Facts and Figures for Dummies Part IV

Share this article on:

(This is the fourth part in a series that brings to the reader some basic facts about energy so that he/she can better understand the raging debate over energy supplies and environmental stewardship.)
just-facts-energy 150Energy Facts and Figures for Dummies Part IV
Natural Resources
* Estimates of crude oil resources are uncertain and subject to change, particularly for tight oil formations.[339] [340]
* Definitions used for estimates of fossil fuel resources include:

  • proved reserves, which are known resources that can be profitably extracted at current prices with current technologies.[341] [342]
  • technically recoverable reserves, which are resources that can be extracted with current technology regardless of economic viability.[343] [344] [345]
  • undiscovered recoverable reserves, which are resources that are not yet discovered but are “estimated to exist in favorable geologic settings.”[346]

* Per EIA, it is “misleading” to make assessments about total fossil fuel resources on the basis of proved reserves. This is because:
Proved reserves are an accounting concept that is based on known projects, and it is not an appropriate measure for judging total resource availability in the long term. Over time, global reserves will likely increase as new technologies increase production at existing fields and as new projects are developed.[347] [348] [349] [350]
* In 1955, America’s proved reserves of oil were equal to 11-12 years of U.S. oil consumption at that time.[351]
* In 1977, the U.S. had 31.8 billion barrels of proved crude oil reserves. If this represented all U.S. crude oil resources, the U.S. would have run out of oil in 1988.[352]
* As of 2013, the U.S. Energy Information Administration (EIA) estimates that the U.S. has 260 billion barrels of technically recoverable crude oil. This figure does not include:

  • oil shale.
  • resources located in areas “areas where drilling is officially prohibited.”
  • about 7 billion barrels of offshore oil located in areas that are not expected to be drilled by 2040.[353]

* 260 billion barrels of technically recoverable crude oil is roughly equivalent to:

  • 76 years of U.S. crude oil production at the 2015 production rate.[354]
  • 50 years of U.S. crude oil consumption at the 2015 consumption rate.[355]

* As of 2013, the U.S. Energy Information Administration (EIA) estimates that the world has 3,357 billion barrels of technically recoverable crude oil. This figure does not include several crude oil resources, such as offshore shale oil, shale oil formations in the Middle East and Caspian region, tight sandstone formations, and other formations that have not yet been quantified by EIA.[356]
* 3,357 billion barrels of technically recoverable crude oil is equivalent to 108 years of worldwide petroleum production at the 2010 production rate.[357]
* According to a 2009 estimate by the U.S. Department of Energy, worldwide oil shale reserves, which are not included in the above estimates of technically recoverable crude oil, are equivalent to about 3.7 trillion barrels of crude oil. In 2009, this was roughly 40% more than all other global reserves of petroleum. About two thirds of these oil shale reserves are located in the U.S.[358]
* In 2010, the U.S. Department of the Interior reported that roughly 45% to 80% of oil shale reserves may be technically recoverable.[359]
* The largest known oil shale reserves are located in the Green River Formation, which is situated in southwestern Wyoming, northeastern Utah, and northwestern Colorado.[360] [361]
* In 2013, the U.S. Department of the Interior reported that the Green River Formation contains about 4.3 trillion barrels of oil shale, and roughly 8% to 27% of this has “a high potential for development.”[362] This amounts to:

  • 68 to 222 years of U.S. crude oil consumption at the 2015 consumption rate.[363]
  • 103 to 334 years of U.S. crude oil production at the 2015 production rate.[364]
  • 11 to 37 years of worldwide petroleum production at the 2010 production rate.[365]

* Per the U.S. Department of the Interior:
More than 70% of the total oil shale acreage in the Green River Formation, including the richest and thickest oil shale deposits, is under federally owned and managed lands. Thus, the federal government directly controls access to the most commercially attractive portions of the oil shale resource base.[366]
* Compiling the above estimates of technically recoverable crude oil and Green River oil shale with high potential for development:

  • the U.S. has 0.6 to 1.4 trillion barrels of crude oil and oil shale reserves, which is equivalent to 112 to 265 years of U.S. crude oil consumption at the 2015 consumption rate.[367]
  • the world has 3.7 to 4.5 trillion barrels of crude oil and oil shale reserves, which is equivalent to 119 to 145 years of worldwide petroleum production at the 2010 production rate.[368]

Natural Gas
* Natural gas is a mixture of fossil fuels (mostly methane) that are gaseous at atmospheric pressure and room temperature. Natural gas is sometimes defined differently because certain fossil fuels that are gases inside the earth become liquids when brought to the surface, and because certain natural gases (like propane) are commonly processed into liquids called natural gas liquids.[369] [370] [371]
* The U.S. Energy Information Administration (EIA) typically classifies natural gas liquids as petroleum. Therefore, the above data on petroleum production, consumption, etc. generally includes these natural gas liquids, and the corresponding data below on natural gas generally does not.[372]
* Natural gas is primarily comprised of organic compounds called hydrocarbons, which consist of carbon and hydrogen.[373]
* Natural gas is mainly thought to be formed of diverse marine organisms that were buried by sediments and transformed by heat, pressure, and time.[374] [375] [376]
* Natural gas and crude oil are often found in the same geological formations. In 2014, roughly 18% of all natural gas extracted from the ground in the U.S. came from crude oil wells.[377] [378]
* The first known natural gas well was drilled in China in 211 BC, and the gas was used for drying salt. The first North American natural gas well was drilled in Fredonia, N.Y., in 1821, and the gas was used for lighting and cooking.[379]
* The vast majority of natural gas is currently transported through pipelines. Prior to the early-to-mid 1900s, natural gas was not widely used because it was difficult to transport large amounts of it over long distances. Since then, advances in pipeline technology and infrastructure have made it economical to transport large volumes of natural gas in many circumstances.[380] [381] [382]
* In circumstances where pipelines are not practical or cost-effective (like when shipping overseas), it is more expensive to ship natural gas than crude oil, because the density of natural gas is 942 times less than crude oil. When shipping overseas, natural gas is often liquefied by cooling it to -258ºF (-161ºC), which reduces its volume by a factor of 610. During this process, about 8-10% of the gas is consumed to generate the energy to cool the gas to these subzero temperatures.[383] [384] [385] [386]
* Before the widespread construction of pipelines, natural gas produced from oil wells was often discarded through burning it (called flaring) or releasing it into the air (called venting).[387] [388]
* In 1949, 11.3% of natural gas extracted from the ground in the U.S. was vented or flared. By 1971, this figure declined to 1.2%, and since then, it has averaged 0.7%.[389]
* In 2014, 1.0% of U.S. natural gas production was vented or flared.[390] Worldwide in 2010, roughly 4.4% of natural gas production was flared (data on venting is unavailable).[391]
* Natural gas and natural gas liquids are combusted for purposes such as space heating, cooking, and electricity generation. Natural gas liquids are also used as ingredients in wide-ranging products, such as plastics, fertilizers, and detergents.[392] [393] [394] [395] [396]
* In 2015, natural gas supplied:

  • 28% of all primary energy consumed in the U.S.
  • 3% of primary energy consumed in the transportation sector.
  • 39% of primary energy consumed in the industrial sector (not including energy purchased from electric power utilities).
  • 76% of primary energy consumed in the residential and commercial sectors (not including energy purchased from electric power utilities).
  • 26% of primary energy consumed in the electric power sector.[397]

Consumption, Production, Imports, and Prices
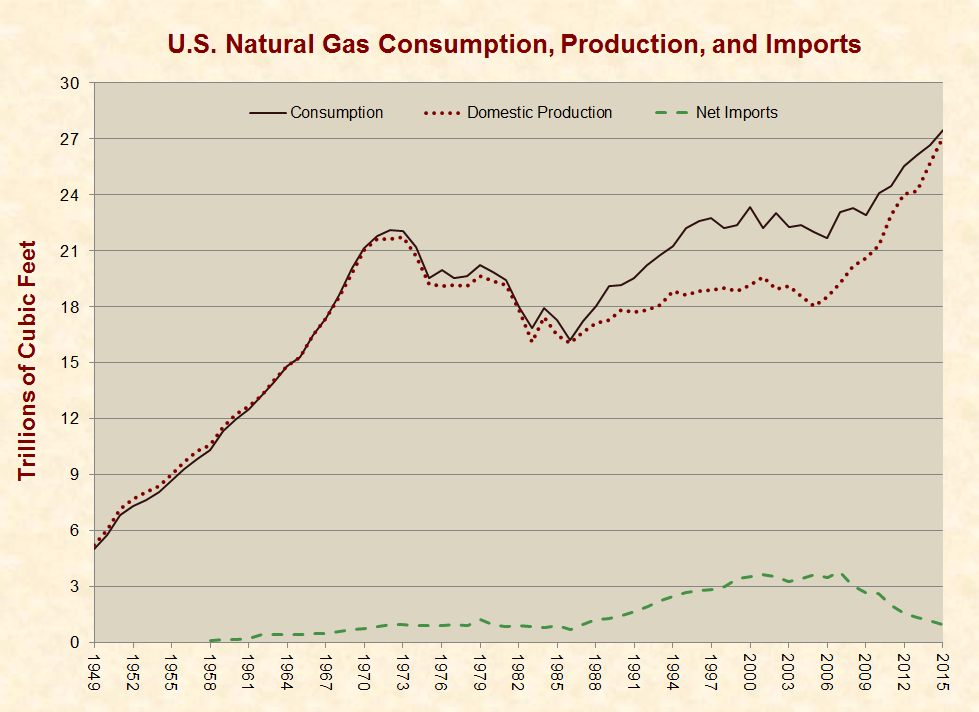
* In 2015, the U.S. consumed about 27.5 trillion cubic feet of natural gas, 3% of which was imported:
[398]
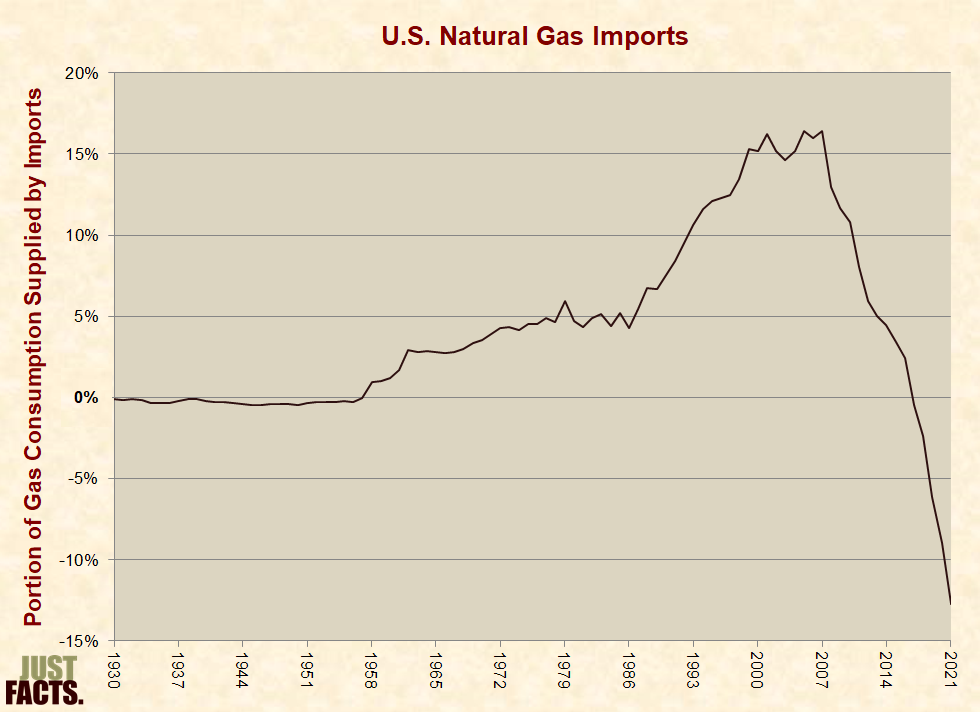
* Between 2007 and 2015, the portion of U.S. natural gas consumption that was imported declined by 79%, primarily as a result of increased domestic production through technologies known as horizontal drilling and hydraulic fracturing (described below):
[399] [400] [401] [402]
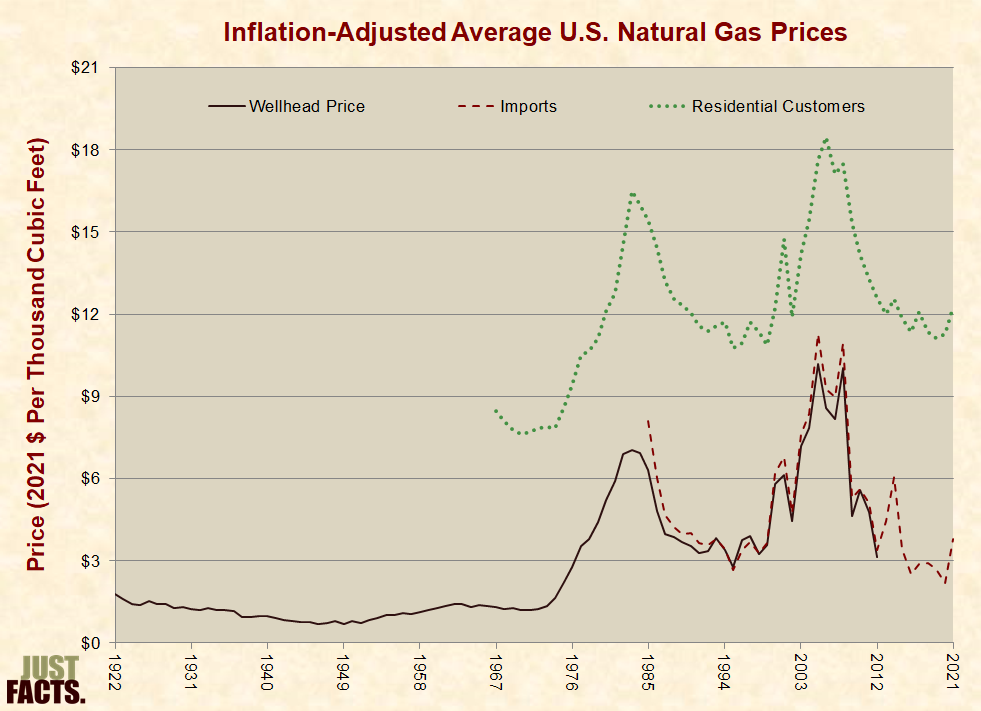
* Natural gas prices are affected by factors that impact supply and demand, such as economic growth and recessions, weather, and technological advancements.[403] [404] [405] [406] Because natural gas is more difficult to transport than petroleum, natural gas prices are more affected by local and regional factors than petroleum prices, which are primarily driven by global factors.[407] [408] [409] [410] [411]
* In 2015, the average production price for natural gas was roughly $2.99 per thousand cubic feet, and the average price for residential consumers was $10.38 per thousand cubic feet.[412]
[413] [414]
Electricity
* In 2015, natural gas supplied 26% of the primary energy consumed in the U.S. electric power sector.[415] Because certain natural gas power plants are more efficient than coal power plants,[416] [417] and because some electricity is generated outside of the electric power sector, during 2015 natural gas supplied:

  • 32% of the electricity produced in the electric power sector.[418]
  • 33% of the electricity produced in all sectors.[419]

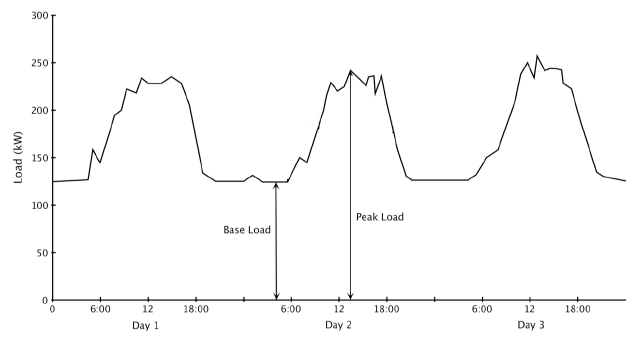
* Demand for electricity varies on an hourly, daily, and seasonal basis due to factors such as:

  • the time of the day, which influences the usage of lighting, computers, and other electric devices.
  • the weather, which influences the usage of heating, air conditioning, and ventilation systems.[420] [421] [422]

* As shown in the following graph, the terms “baseload” and “peak load” are used to describe the minimum and maximum demands for electricity over a given time period. The term “intermediate load” is used to describe the range between them.[423] [424]
[425]
* Natural gas is the dominant energy source for generating intermediate and peak load capacity because:

  • natural gas power plants can ramp up and down quickly, which is ideal for intermediate and peak load capacity.
  • natural gas power plants are less expensive to build than coal and nuclear power plants.[426] [427] [428] [429]

* Coal is the dominant energy source for generating baseload capacity because once built, low fuel costs make coal plants inexpensive to run continuously, which is ideal for generating baseload capacity.[430] [431] [432]
* In 2009, natural gas became competitive with coal for generating baseload capacity in some areas of the U.S. This was primarily due to increased domestic natural gas production, which reduced prices. Other factors included increased coal prices, stricter environmental regulations, and expansion of natural gas pipelines.[433] [434] [435] [436]
* In 2012, both coal and natural gas fuels were competitive for generating baseload capacity under differing circumstances in different regions of the U.S.[437]
* Due to their higher efficiency, natural gas power plants that employ a technology called “combined cycle” can generate baseload power less expensively than coal plants when natural gas is about 1.5 times the price of coal.[438] [439] [440] In 2015, the average energy-equivalent price paid by electric power plants for natural gas was about 1.5 times the price of coal.[441]
                                                                 To be Continued …………..

Email this author

Posted in Energy | Comments Off on Energy Facts and Figures for Dummies Part IV