Having the right credentials is getting an increasing amount of attention among firms and job seekers.
Businesses want to know that prospective employees have the knowledge, skills and ability to successfully perform a job.
Job seekers want to stand out as the most qualified among a large pool of applicants.
Credentials are becoming increasingly recognized by employers and sought after by workers in addition to or in the place of more conventional education levels.
One problem is that the federal government has not collected information to show whether credentials are worth it.
The Bureau of Labor Statistics provides data on wages and unemployment rates by education levels. It shows that more highly educated people generally get paid more and have a lower unemployment rate than less educated people.
When showing these statistics during speeches, audience members often ask if there are data pertaining to certain certifications. They typically ask that question because they know of an individual who earned a certification in less than a year and now makes a higher income than a recent college graduate.
My answer has been that the Bureau of Labor Statistics does not collect that type of data. But I’ll soon be able to provide a better response.
Probably driven in part by the increases in tuition and student loan defaults, the federal government put together an interagency working group late in 2009 to consider collecting data on certifications and licenses.
They define credentials as certifications or licenses. Certifications, such as those for information technology or project management, are awarded by non-government bodies and indicate the individual can perform a specific job.
Licenses are awarded by a government agency based on criteria that may include passing an exam or completing an apprenticeship that conveys legal authority to work in an occupation. Registered nurse licenses and cosmetology licenses are two examples.
In both cases, the credential needs to be renewed periodically.
However, a digital arts certificate or a motorcycle mechanics diploma may not be counted in this new database because they have been granted at a point in time when no continuing training is needed to demonstrate that they remain qualified for a certain occupation.
The labor bureau started including three high-level questions about certifications and licenses in its household survey in 2015, and the results were released earlier this year.
Although regional data are not available, national averages indicate that credentials provide an edge in the labor market to those who hold them:
The unemployment rate for those holding credentials was lower in 2015 (2.7 percent) compared with those without them (6.1 percent); and
The earnings for those with credentials were more than those without.
The bureau’s survey did not provide information on the type of credential obtained relative to unemployment or wages.
However, the U.S. Census Bureau is conducting such a survey that the agency expects to release in 2017. Once that study is released, job seekers will have more detailed information on the certifications and licenses that are commonly held by certain types of workers and that pay well.
(This article first appeared in the Sept. 4 issue of the Richmond Times Dispatch) Email this author
Posted inUncategorized|Comments Off on Economic Impact: Are Having Work Credentials Worth It?
Back in March the portion of the Texas SH 130 toll road that was developed as a public-private partnership (P3) concession filed for bankruptcy, since toll revenue had not recovered enough post-recession to cover its debt service. And last month, the SH 130 Concession Company filed a bankruptcy plan in federal court, transferring ownership to its major lenders. These events have triggered a number of responses, some based on limited knowledge of toll concessions and others by ardent opponents of tolling, per se.
In the first category was a piece in industry journal Engineering News-Record, “When Toll-Road Flows Fall Short.” While acknowledging that the Texas toll road opened during the Great Recession, it added that “SH 130’s disappointing traffic and revenue performance is consistent with other toll projects that have involved private financing.” In evidence, it cited only Virginia’s Pocahontas Parkway, along with several bankruptcy filings in Australia. But that was hardly a balanced portrayal of the outcome of recent U.S. toll projects.
Far worse was an Aug. 23rd piece in a toll-hating online publication calledTheNewspaper.com. Its article on the SH 130 filing claimed that “Nearly every high-profile tolling project has failed,” citing the Indiana Toll Road, California’s 91 Express Lanes, San Diego’s South Bay Expressway, and the three toll roads of the Transportation Corridor Agencies (TCA) in Orange County, CA. As almost everyone realizes, the 91 Express Lanes are an economic and financial success, never went bankrupt, and were purchased by the Orange County Transportation Authority only to get around an overly restrictive non-compete clause (the likes of which nobody is doing any more). As for the TCA toll roads, they never went bankrupt, were refinanced successfully, and have had solid increases in traffic and revenue post-recession.
There have been several bankruptcy filings by P3 toll projects in this country, but those projects all share several characteristics. First, they were financed based on traffic forecasts made prior to the Great Recession, which failed to account for the impact on traffic and revenue of a severe recession. Second, there were no taxpayer bailouts of any of them. Each was financed via revenue bonds and loans plus developer equity investments, with only the investors at risk of losses, not taxpayers. Third, the equity providers in each case lost their initial investments, which as sophisticated investors they knew up-front was a possibility.
As for the claim that “nearly every high-profile tolling project has failed,” that is easily shown to be false. First, there has not been a single failure of an express toll lanes project—whether financed by the private sector or by a state DOT. In fact, a number of these projects are having to raise their peak-period tolls above the levels in their traffic and revenue forecasts in order to maintain the uncongested traffic flow promised to their customers. Among those in the news recently are the I-95 Express lanes in Miami, the I-85 Express lanes in Atlanta, the I-110 Express lanes in Los Angeles, and the I-405 Express Lanes in Seattle. Pew Charitable Trusts’ Stateline carried a good article on this phenomenon this week, “Express Lanes Have a Popularity Problem.”
Another piece of evidence is the market to acquire investor-financed toll roads. To be sure, nobody bid for the failed Pocahontas Parkway in Virginia or the Southern Connector in South Carolina, but those were projects for which enough demand really was not there to cover their capital and operating costs. By contrast, both the bankrupt Indiana Toll Road and the struggling Chicago Skyway have such good long-term fundamentals that both concessions were bought last year by consortia of pension funds for significantly more than the original concession deals—$5.7 billion for ITR and $3.8 billion for the Skyway. Even the sometimes-troubled Dulles Greenway in Virginia seems to be prospering as of 2016, to the point that 50% owner Macquarie Atlas Roads is seeking to purchase the other 50%.
So when anti-toll groups such as the Alliance for Toll-Free Interstates make claims such as “toll roads have a track record of failure,” don’t take their word for it. Instead of listening to what interest groups say, watch what investors do. (This article first ran in the September issue of Surface Transportation Innovations) Email this author
Posted inTransportation|Comments Off on Toll Road Reorganization Unleashes Critics of Tolling and Concessions
(Editor’s note: This is the third in a series on the Trans Pacific Partnership.) Labor Day has passed, and it is time to continue deciphering the Trans Pacific Partnership (TPP). As in the other 30 chapters of the TPP, there are two sections in Annex 2-D setting forth Chile’s position. The first entails Chile’s general notes to the tariff schedule as well as its 291 pages listing present tariff rates and the rates on products when and if TPP ever enters into force of law.
Chile’s general notes section makes several trade commitments, as do other nations’. For example, most nations agree that “Customs duties on originating goods provided for in the items in the staging category [eliminated on entry into force] (EIF) shall be eliminated entirely, and these goods shall be duty free on the date of entry into force of this Agreement for Chile”. This language sounds encouraging until you read subsequent paragraphs that Chile has inserted into the agreement.
Two categories indicate that certain goods that fall into “staging category B4” will be eliminated in four years and whatever goods are in this category will be duty free after year four. Another category called B8 incorporates the same scheme and goods would be duty free after eight years. Another side deal
The agreement is further complicated when Chile indicates that customs duties on products such as wheat will be governed by another side deal. For example, a Chile-Australia free trade agreement consummated in 2008 will govern wheat tariffs. Similarly customs duties on sugar shall be the same as established by the Chile-Australia free trade agreement signed in 2008.
Because category after category appears to be governed by a separate agreement identified but not attached, may be one reason the presidential candidates in 2016 are in opposition to this opaque document. It is interesting that virtually all the prior agreements involve wheat and sugar.
The actual tariff schedule for Chile is 291 pages and spells out the present tariff base rate and then for most of the items shows that on year one, the agreement is entered into, tariffs go to zero.
For example, in the category of Live Animals, the tariff base rate is presently 6%. The category covers live horses, mules, purebred breeding animals, live bovine, sheep, goats and poultry. For turkeys, however, a Canadian importer would have to pay a tariff of 5.2% the first year and in year eight, the tariff would be zero. The turkey producers of Canada appear to be singled out by this agreement.
There are entire categories of products such as tuna, sardines, tilapia, turbot, and tens of other fish products where an existing 6% tariff is reduced to zero.
Milk and cream which is concentrated or contains added sugar or sweetening matter, interestingly goes from a 6% tariff to 5.2% tariff in the first year. Each year the tariff is reduced through year eight when it becomes zero. The list goes on and on
On page 27 there is an incredibly detailed listing of various milk products. A certain tariff will be applied if milk has a “fat content exceeding 1.5% but not exceeding a 6% by weight.” The list goes on and on and if the milk has a fat content of 26% or more the tariff is 5.2% and eventually reduces to zero in year 8. Then the tariff schedule lists other products such as fresh unripen or uncured cheese that will come in with a zero tariff imposed. Mozzarella cheese is treated differently. Presently a 6% base rate is imposed and when this cheese comes in from countries such as Australia, Japan, Mexico and the United States there will be a 5.2% tariff and eventually reaching zero in year 8.
The tariff schedules, as noted, are mind numbing but instructive. As stated earlier, the trend appears to be the reduction of tariffs on products exported into Chile.
The section on wheat is indecipherable. On page 46 wheat has a 6% tariff imposed and the words “plus specific duty” added. Then in the remarks column on wheat there appears to be a different treatment for each country and then in years1 to 8, a separate side agreement appears to govern. Presumably the experts at U.S. Wheat Associates could more fully answer the questions raised on pages 46, 47 and 48. The agreement is so specific it deals with soft red winter wheat “containing humid gluten higher or equal to 30% by weight.” According to the agreement there is an agreement separately with each country for the importation of wheat.
Six percent appears to be the base rate imposed on thousands of products exported to Chile. A review of the tariff schedule appears to eliminate virtually all of these tariffs by year eight.
(This column first ran in Farm Futures on September 8, 2016) Email this author
Posted inAgriculture|Comments Off on Deeper analysis on potential Pacific trade pact: Chile
EDITOR’S NOTE: (This is part V of a series on energy. We hope it helps the reader better understand the issues facing our country and our state as we endeavor to tackle the problem of providing our citizens and our businesses with their energy needs.)
Transportation
* In 2015, natural gas supplied 3% of the energy used in the U.S. transportation sector.[442]
* Between 2007 and 2013, the combination of increased oil prices, decreased natural gas prices, increased domestic natural gas production, and stricter environmental regulations created incentives to use natural gas more widely for transportation.[443][444][445][446] Steep declines in oil prices since 2014 have made natural gas less competitive as a transportation fuel.[447][448][449]
* Other disincentives to the wider use of natural gas in transportation include (1) the capital costs of equipping service stations to dispense natural gas, and (2) the lower energy density (per unit volume) of compressed or liquefied natural gas, as compared to gasoline and diesel.[450][451][452][453][454] Per EIA:
Energy density and the cost, weight, and size of onboard energy storage are important characteristics of fuels for transportation. Fuels that require large, heavy, or expensive storage can reduce the space available to convey people and freight, weigh down a vehicle (making it operate less efficiently), or make it too costly to operate, even after taking account of cheaper fuels. Compared to gasoline and diesel, other options may have more energy per unit weight, but none have more energy per unit volume. …
… [C]ompressed fuels require heavy storage tanks, while cooled fuels require equipment to maintain low temperatures.[455]
* In 2012, the only factory-built compressed natural gas car available to non-fleet customers in the U.S. was the Honda Civic Natural Gas. It was the “cleanest internal-combustion vehicle ever tested by the U.S. Environmental Protection Agency.”[456] Compared to a similarly equipped Honda Civic EX, the natural gas model:
Had 41-48% less range (220-248 miles versus 422).
Had 29% less horsepower (110 hp versus 140).
Had 14% less torque (110 lb-ft versus 128).
Had 51% less trunk space (6.1 cubic feet versus 12.5).
* Based on the average nationwide prices of gasoline and compressed natural gas in July 2013, the 2012 Civic Natural Gas would recoup the $5,650 cost premium over the standard model after 111,000 miles of driving.[461]
* Based on the average nationwide prices of gasoline and compressed natural gas in 2015, the 2015 Civic Natural Gas would recoup the $5,700 cost premium over the standard model after more than two million miles of driving.[462]
* In 2015, Honda announced it was cancelling the Civic Natural Gas after 2015 due to low gasoline prices and a lack of consumer demand.[463]
* Per Vivek Chandra, a natural gas industry consultant and the author of Fundamentals of Natural Gas:[464]
Natural gas holds the greatest promise as a fuel for fleet vehicles that refuel at a central location, such as transit buses, short-haul delivery vehicles, taxis, government cars, and light trucks. There are currently approximately 65,000 natural gas vehicles (NGVs) in operation in the United States using CNG [compressed natural gas] and LNG [liquefied natural gas] as their main fuels.[465]
* Home fueling is possible with natural gas vehicles, but as of 2016, Honda does not recommend this for the Civic Natural Gas because “of moisture and other contaminants inherent in some natural gas supplies, and the inability of some home refueling systems to adequately dry the gas and remove contaminants….”[466]
Extraction Methods
* Natural gas resources can be grouped into two major categories based upon their accessibility:
conventional natural gas, which is located in porous rocks and reservoirs that allow the gas to freely flow to the surface of the earth when it is accessed through drilling.[467][468]
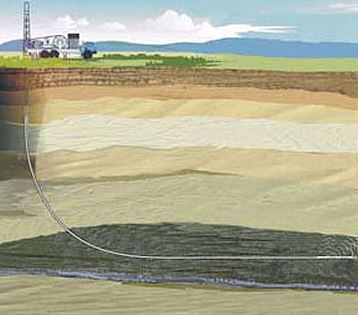
shale gas or tight gas, which is located in semi-porous or non-porous rocks that don’t allow the gas to freely flow when accessed through drilling. This natural gas can be extracted by using a combination of technologies known as horizontal drilling and hydraulic fracturing.[469][470][471][472]
* Horizontal drilling involves penetrating the ground vertically (like traditional drilling) and then turning horizontally in order to drill along the layer that contains the fossil fuel resources. This method of drilling exposes more of the fossil fuel resources to the bore of each well, thus increasing yields and decreasing the surface footprint of drilling operations.[473][474]
* Horizontal drilling was first successfully employed in 1929 and has been used commercially since the late 1980s. By 1990, more than 1,000 horizontal wells were drilled worldwide, almost all for the purpose of extracting crude oil.[476]
* Hydraulic fracturing or fracking involves injecting fluids at high pressures from the bore of the well into the layer that contains the fossil fuel resources. This process creates fractures in the rock, which allows natural gas to flow to the bore of the well. The fluids used for fracking typically contain sand or ceramic beads that serve to hold open the fractures after they have been created. This fluid also contains varying chemicals that are used for purposes such as preventing pipe corrosion.[477][478] (A detailed description of the process is shown in the video below.)
* Hydraulic fracturing was first successfully employed to drill for oil in 1947 and has been used commercially since the 1950s. By 1955, more than 100,000 fracking treatments were performed. In the 1980s and early 1990s, Texas oilman George Mitchell refined the process of fracking to extract natural gas from shale in a cost-effective manner.[479]
* In the early 2000s, horizontal drilling coupled with hydraulic fracturing became widely used to extract natural gas from shale. In the mid-2000s, the combination of these technologies also became widely used to extract oil from shale.[480][481][482] The process is shown in this video:
* From 2005 to 2015, U.S. natural gas production increased by 50%, primarily due to the use of horizontal drilling coupled with hydraulic fracturing in shale formations.[483][484][485]
* As of 2013, horizontal drilling coupled with hydraulic fracturing has not been widely used to extract natural gas outside the U.S.[486][487] In 2013, the U.S. Energy Information Administration (EIA) estimated that 32% of worldwide technically recoverable natural gas resources are located in shale formations.[488]
* For facts about the environmental impacts of horizontal drilling and hydraulic fracturing, visit the politics section of this research.
Natural Resources
* Estimates of natural gas resources are uncertain and subject to change, particularly for shale formations.[489][490]
* Definitions used for estimates of fossil fuel resources include:
Proved reserves, which are known resources that can be profitably extracted at current prices with current technologies.[491][492]
Technically recoverable reserves, which are resources that can be extracted with current technology regardless of economic viability.[493][494][495]
Undiscovered recoverable reserves, which are resources that are not yet discovered but are “estimated to exist in favorable geologic settings.”[496]
* Per EIA, it is “misleading” to make assessments about total fossil fuel resources on the basis of proved reserves because “proved reserves are an accounting concept that is based on known projects, and it is not an appropriate measure for judging total resource availability in the long term.”[497][498][499][500]
* In 1977, the U.S. had 207 trillion cubic feet of proved natural gas reserves. If this represented all U.S. natural gas resources, the U.S. would have run out of natural gas in 1989.[501]
* As of 2013, the U.S. Energy Information Administration (EIA) estimates that the U.S. has 2,276 trillion cubic feet of technically recoverable natural gas. This figure does not include resources located in areas “areas where drilling is officially prohibited,” and it does not include about 33 trillion cubic feet of offshore natural gas located in areas that are not expected to be drilled by 2040.[502]
* 2,276 trillion cubic feet of technically recoverable natural gas is equivalent to:
84 years of U.S. natural gas production at the 2015 production rate.[503]
83 years of U.S. natural gas consumption at the 2015 consumption rate.[504]
* 21,897 trillion cubic feet of technically recoverable natural gas is equivalent to 197 years of worldwide natural gas production at the 2010 production rate.[505]
* The figures above do not account for methane hydrates, which are “cage-like lattices of water molecules containing methane, the chief constituent of natural gas.” Globally, these resources are estimated to be equivalent to 10,000-100,000 trillion cubic feet of natural gas, or 90-900 years of worldwide natural gas production at the 2010 production rate.[506][507]
* Per EIA, methane hydrates:
may represent one of the world’s largest reservoirs of carbon-based fuel. However, with abundant availability of natural gas from conventional and shale resources, there is no economic incentive to develop gas hydrate resources, and no commercial-scale technologies to exploit them have been demonstrated.[508]
Coal
* Coal is a class of combustible rocks that are at least 50% carbon by weight.[509][510]
* Coal is categorized into different “ranks,” primarily depending upon how much of it is comprised of carbon. Coals with higher carbon content generally contain more energy and have a higher rank. The main ranks of coal (from lowest to highest) are lignite, subbituminous coal, bituminous coal, and anthracite.[511][512][513][514]
* Coal is formed of plant materials that have been buried and transformed by pressure, heat, and time.[515]
* Coal may have been used as early as 3,000 years ago to smelt copper in China, and it was used in England for cooking during the era of the Roman Empire. The burning of coal to generate heat became widespread in Europe during the mid-1600s to early 1700s. Coal usage continued to expand and diversify through the 1800s, particularly as fuel for powering steam engines.[516][517]
* Today, coal is the world’s leading fuel for generating electricity. Due to attributes such as low cost and widespread availability, coal accounted for 40% of global electricity production in 2012.[518][519][520]
* More than 90% of the coal produced in the U.S. is used to generate electricity.[521]
* Coal is also:
combusted to generate heat for industrial processes and for commercial, military, and institutional facilities.[522]
16% of all primary energy consumed in the U.S.
37% of primary energy consumed in the electric power sector.
7% of primary energy consumed in the industrial sector (not including energy purchased from electric power utilities).
total electricity generation from coal will increase by 23% between 2012 and 2040.
coal will decrease from 40% of total world electricity generation in 2012 to 29% by 2040.
coal with continue “to be the largest single fuel used for electricity generation worldwide” through 2040.[526]1% of primary energy consumed in the residential and commercial sectors (not including energy purchased from electric power utilities).[527]Many nations have enacted polices to limit the use of coal in order to reduce greenhouse gases. Based upon these policies and other variables, the U.S. Energy Information Administration projected in 2016 that:
* In 2015, coal supplied:
* In 2014, the U.S. had 1,145 coal-fired electricity generating units located at 491 electric power plants.[528]
* Because coal power plants are less efficient than certain natural gas power plants,[529][530] and because some electricity is generated outside of the electric power sector, during 2015 coal supplied:
37% of the primary energy consumed in the U.S. electric power sector.[531]
34% of the electricity produced in the U.S. electric power sector.[532]
33% of the electricity produced in all U.S. energy sectors.[533]
If you thought the scandal of the Alexandria school principal weeding out weak students from the Standards of Learning (SOL) exams was bad, you ain’t heard nothing yet. In a superb piece of investigative journalism, Cherise Newsome with theVirginian-Pilot has exposed SOL-gaming in Norfolk that was more grotesque by far.
To improve SOL testing scores, Norfolk educators yanked marginal students out of second-semester classes so they could repeat the first semester — and avoid taking the SOL. Educators justified the practice on the grounds that students needed the remedial teaching (which they undoubtedly did). But Katz uncovered plenty of evidence that school administrators were motivated by a desire to improve SOL scores.
Norfolk principals and senior administrators told The Pilot that no students were moved just to avoid testing, but one Lake Taylor High teacher disputes that. The teacher – along with one other and a former administrator at different schools who shared similar accounts – spoke on condition of anonymity because of fear of retribution.
The Lake Taylor teacher said educators were told to make sure there was a defensible reason for pulling kids out ahead of the exams, buying the school more time to improve its accreditation. Lake Taylor hasn’t been fully accredited since 2012-13.
“We were encouraged to make the student fail,” the teacher said. “So even if a student had a D-minus, we were told to make sure to give them something to bring them down a little bit, and don’t provide opportunities for them to make it up because you want them to remain failing so they can repeat first semester.”
Targeted students would take the second part of the SOL course during the following fall. So their schedules were out of order, and they didn’t remember what they had learned, the teacher said: “It didn’t fix any problems. It was just a bad solution.”
Claudia Sweeney, a former Lake Taylor High counselor who retired three years ago, backed up that account. Teachers feared for their jobs and did what they were told, she said. …
The Pilot interviewed a half-dozen students and parents who said the schedule changes put them behind on requirements and caused some to miss out on a standard diploma. The students, including some with special education plans and others who had been on an honors track, provided schedules and transcripts showing they took SOL classes out of order or repeated them.
The practice of “recycling” students does have a justification. As former Granby High School Principal Ted Daughtrey said: “We picked, targeted certain students with certain averages to come back to first-semester classes. … We’re talking about kids that can’t add or subtract positive numbers. They’re just very far behind. So to expect them to be successful in Algebra I in a year is a pipe dream.”
True enough, a child who cannot add or subtract positive numbers has no business taking an Algebra I class. But that begs the question: How did those children get promoted to the Algebra I class in the first place? Why wait to take remedial action until they reached a grade where they took the SOLs? And, if it’s the students the administrators care about, how does it help to enroll them in the second-semester class the following year?
Then Daughtrey spills the beans:
“The picture I’m trying to paint is, if we had left those kids in there like we had in the past, they would have penalized us, not because we weren’t working but because they weren’t coming to school and doing what they needed to do,” Daughtrey said.
When asked what he meant by “penalize us,” he said, “We might not have met the 70 percent pass rate for state accreditation.”
Bacon’s bottom line: Please note: There is nothing illegal with any of this. That’s the real scandal.
Moreover, I cannot imagine that Alexandria and Norfolk are the only school systems in Virginia where SOL gaming is going on. What’s the next shoe to drop? At what point do we recognize that we have an endemic problem, especially in schools with large numbers of disadvantaged, low-performing students? Whose interests are being served by the SOL gaming — those of the students or of the school administrators? — Hat tip: John Butcher)
(This article first ran in Bacons Rebellion on September 12, 2016) Email this author
Posted inEducation|Comments Off on "We Were Encouraged to Make the Student Fail"

 Having the right credentials is getting an increasing amount of attention among firms and job seekers.
 Email this author
 Back in March the portion of the Texas SH 130 toll road that was developed as a public-private partnership (P3) concession filed for bankruptcy, since toll revenue had not recovered enough post-recession to cover its debt service. And last month, the SH 130 Concession Company filed a bankruptcy plan in federal court, transferring ownership to its major lenders. These events have triggered a number of responses, some based on limited knowledge of toll concessions and others by ardent opponents of tolling, per se.

 Labor Day has passed, and it is time to continue deciphering the Trans Pacific Partnership (TPP). As in the other 30 chapters of the TPP, there are two sections in Annex 2-D setting forth Chile’s position. The first entails Chile’s general notes to the tariff schedule as well as its 291 pages listing present tariff rates and the rates on products when and if TPP ever enters into force of law.

 Transportation
 * Coal is a class of combustible rocks that are at least 50% carbon by weight.

 If you thought the scandal of the
