A Careful Look at the Trump Infrastructure Proposal

Share this article on:

Since the November 8th election, a flurry of media attention has been devoted to the “Trump infrastructure plan.” As I pointed out in my column in the November Public Works Financing, three separate proposals have been made by people involved with the campaign or the transition: a $550 billion number with no details on how it would be paid for, a suggestion of an infrastructure bank, and a $1 trillion proposal for P3 infrastructure, developed by investment banker Wilbur Ross and economist Peter Navarro. The latter is the only proposal with details, so it has become the focus of most of the attention in recent weeks. (http://reason.org/news/show/trump-era-bring-new-infrastructure)
Amazingly, many people seem to have interpreted the $1 trillion number as implying new federal spending of that volume. But the only federal money in the Ross/Navarro proposal is up to $137 billion in tax credits for P3 projects—assuming that a total of $1 trillion worth were ultimately financed and built. But the mistaken idea of a trillion-dollar flood of federal dollars sent the stock prices of engineering and construction firms soaring 10-50% in the three weeks following election day. The flip side of this misunderstanding is that a number of fiscal conservatives in Congress have denounced the proposal as if it actually were a trillion-dollar call on the federal budget.
But as the true P3 nature of the proposal sinks in, an array of commentary has emerged from diverse sources. Wall Street Journal financial writer Spencer Jakob pooh-poohed P3 toll roads, citing a Congressional Budget Office report that found that four out of 14 such projects either filed for bankruptcy or were bought out by the public sector. As privatization expert Steve Savas noted in a letter to the editor, the Orange County project (the 91 Express Lanes) has been highly successful and was bought by the county transportation authority only so it could do away with an overly stringent non-compete provision. And the formerly troubled Chicago Skyway and Indiana Toll Road (ITR) were both purchased last year by pension funds at a large premium to their last-decade asset value.
More predictable have been attacks from the political left. Streetsblog‘s Angie Schmitt claimed that P3 concessions rely mostly on “other people’s money,” which implies taxpayers’ money—which is false. According to a recent tally in Public Works Financing, the average U.S. revenue-risk P3 highway project was financed with 25% equity, and most of the rest by debt that is to be serviced by toll revenues. The just-financed I-66 express toll lanes project in Virginia involves 40% equity, and last year’s pension-fund acquisitions of the Skyway and ITR both involved more than 50% equity.
One of the longest critiques of the Ross/Navarro P3 proposal is from Kevin DeGood of the Center for American Progress. I don’t have space here for a detailed rebuttal; my Reason colleague Baruch Feigenbaum posted one last week, “Center for American Progress Critique of Trump’s Infrastructure Plan Is Misleading” (http://reason.org/news/show/center-for-american-progress-critic).
One of DeGood’s main complaints is about the proposed tax credits for the equity investors, about which he writes, “Aside from enriching Wall Street, what does this federal subsidy buy? The answer is effectively nothing.” Which would be nonsense if the tax credit actually generated nearly $900 billion in sound projects to repair and replace aging and inadequate infrastructure. Yet, as I wrote in my PWF column, the tax credit is unlikely to be needed. P3 infrastructure investors have plenty of incentive to invest in sound U.S. projects; their problem is that only a handful of projects are on offer. And that contrasts sharply with countries like Australia, Canada, Chile, Colombia, France, and many others where P3 infrastructure is national policy.
In addition to DeGood, a number of reporters have put forth the idea that projects with bondable user-fee revenue streams are few and far between. But that is mostly false and generally misleading. To be sure, most states do not yet have workable P3 enabling legislation. But there are thousands of candidate projects out there. In the highway sector, the potential for toll-financed replacement of worn-out Interstate highways and bridges is a $1 trillion unfunded need all by itself. America also has a very large unfunded need to replace aging municipal water systems. The good news for that sector is that user fees (water bills) are a long-established reality. Airports and seaports also have long-established user-fee revenue streams. About the only public infrastructure sector that doesn’t is the inland waterway system (see article below).
What DeGood and other P3 opponents want is an expansion of traditional design-bid-build infrastructure funding, with its built-in potential for cost over-runs, schedule delays, and low construction costs at the expense of high maintenance costs, resulting in wastefully high life-cycle costs. And of course, “highways to nowhere” that would never pass a benefit/cost requirement, let alone a realistic return on investment hurdle. Long-term P3 concessions address all those shortcomings of the status quo. That’s why I see the Trump proposal, via Ross and Navarro, as a breath of fresh air, despite its largely irrelevant call for federal tax credits.
(This article first ran in the December issue of Surface Transportation Innovations)
Email this author

Posted in Transportation | Comments Off on A Careful Look at the Trump Infrastructure Proposal

Another Major Victory for Agriculture

Share this article on:

On Nov. 21, 2016, EPA won an important case for American farmers. EPA defended farmers’ rights to plant seeds coated with neonicotinoids – a class of insecticides that kill insects by affecting central nervous system. Coated seeds will continue to be exempt from EPA regulation under the Federal Insecticide, Fungicide, and Rodenticide Act (FIFRA) because of this court case.
The Center for Food Safety (CFS), American Bird Conservancy, Pesticide Action Network North America, and Pollinator Stewardship Council sued EPA claiming it failed to enforce FIFRA regarding seeds planted by American farmers. CFS is an environmental advocacy organization “…working to protect human health and the environment by curbing the use of harmful food production technologies and by promoting organic and other forms of sustainable agriculture.”
CFS, bee farmers and other environmental groups claimed that many seeds planted by farmers in the U.S. are coated with neonicotinoids. This pesticide treated material can be distributed through the plant and kill insects both by direct contact and from the plant if ingested. “Additionally, these seeds, when planted, can release pesticidal ‘dust-off’ that further spreads neonicotinoids beyond the seeds themselves.”
CFS and other plaintiffs claimed the practice of coating seeds with neonicotinoids “…has a systematic and catastrophic impact on bees and the beekeeping industry…” Under FIFRA, pesticides are required to be registered by EPA prior to use. There is an exception from FIFRA registration if the pesticide in question is already adequately regulated. In 1988 EPA exempted from FIFRA registration any “…articles or substances…treated with, or containing, a pesticide to protect the article or substance itself…if the pesticide is registered for such use.” For decades, American farmers have not needed to purchase FIFRA regulated seeds because of this exemption. The dispute in this case arose because EPA published a document in 2003 which discussed the harmonization of regulation of pesticide coated seeds used in Canada and the United States. In this document, EPA said treated or coated seeds were exempted if the “…pesticidal protection imparted to the treated seed does not extend beyond the seed itself to offer pesticidal benefits or value attributable to the treated seed.” Consequently when farmers’ plant treated seeds and the pesticide is registered, then the seed is exempt from registration under FIFRA.
In 2013, EPA issued a guidance document discussing pesticide related bee deaths. In court, plaintiffs made a legal argument that this document was a “final action” and not a “guidance document”. (If a “final action” had been taken an exhaustive record would be needed to support EPA’s decision.) EPA’s guidance stated clearly that it was recommending procedures for inspectors when investigating bee deaths caused by possible dust-off from treated seeds. The opinion then delves into what constitutes legal final action or what is merely guidance which is not reviewable under the Administrative Procedures Act (APA). CFS and the other plaintiffs claimed the bee incident guidance exceeded EPA’s authority and should have applied APA’s rulemaking requirements.
Several well known agricultural groups including CropLife America, American Seed Trade Association, Agricultural Retailers Association and several commodity groups intervened in this case to help protect American farmers from CFS.
The U.S. District Court judge threw out the farm groups’ Motion for Summary Judgment claiming it was moot. The Court did state that it “…is most sympathetic to the plight of our bee population and beekeepers.” The plaintiffs themselves claimed that coating seeds with neonicotinoids is having a catastrophic impact on the beekeeping industry. The Court and plaintiffs might review a Washington Post story, July 23, 2015, which noted that U.S. honey bee colonies had hit a new high. Others, including The White House, put out a study on the health of honey bees. The reason was beekeepers did notice mysterious die-offs called “Colony Collapse Disorder” (CCD). According to USDA, even with CCD, honey bee colonies have risen since 2006 from 2.4 million to 2.7 million in 2014. In fact, commercial honey producing bee colonies “…is now the highest it has been in 20 years”.
(This article first ran in Farm Futures on Nov. 29, 2016)
Email this author

Posted in Agriculture | Comments Off on Another Major Victory for Agriculture

Energy Facts & Figures for Dummies Part X

Share this article on:


(This is part X of this series on energy. We hope it helps the reader better understand the issues facing our country and our state as we endeavor to tackle the problem of providing our citizens and our businesses with their energy needs.)
COMPETING OBJECTIVES
* Choosing between different forms of energy often involves tradeoffs between competing objectives, such as affordability, environmental impacts, and energy security. These tradeoffs can sometimes be impossible to objectively quantify.[873] [874] [875] [876] [877]
* A 2008 Harris poll of 1,020 U.S. adults found that 92% favored “a large increase in the number of wind farms.”[878] The same poll found that among 787 U.S. adults who pay household energy bills:

  • 40% were not willing to pay anything more for energy from renewable sources.
  • 48% were willing to pay at least 5% more.
  • 31% were willing to pay at least 10% more.
  • 14% were willing to pay at least 15% more.
  • 7% were willing to pay at least 20% more.
  • 3% were willing to pay at least 30% more.
  • 1% were willing to pay at least 40% more.[879]

* In 2015, the U.S. Energy Information Administration (EIA) projected that the levelized cost of electricity generated by new onshore wind power in 2020 will be 1% higher than that from advanced combined cycle natural gas [Adv CC], and the cost of photovoltaic [PV] solar will be 73% higher than Adv CC.[880] Per EIA, these levelized costs “significantly understate the advantage of Adv CC relative to onshore wind … while overstating the advantage of Adv CC relative to solar PV….”[881] See the section above on the costs of electricity for extensive details about comparing the costs of electricity generating technologies.
* A 2010 Rasmussen poll of 1,000 likely voters found that:

  • 56% were not willing to pay more taxes or higher utility costs to “generate cleaner energy and fight global warming.”
  • 37% were willing to pay at least $100 more per year.
  • 18% were willing to pay at least $300 more per year.
  • 8% were willing to pay at least $500 more per year.
  • 5% were willing to pay at least $1,000 more per year.
  • 2% were willing to pay in excess of $1,000 more per year.[882]

* During 2015, the average cost of ethanol without federal subsidies was 38% higher than gasoline, and the average cost of biodiesel without federal subsidies was 118% higher than gasoline.[883]
* Per a 1992 EIA report:

Much current debate on energy policy focuses on externalities associated with energy use. Many believe there is a large implicit subsidy to energy production and consumption insofar as pollution results in environmental costs not fully charged to those responsible. …
In fact, the effort to deal with environmental concerns has become a central feature of Federal energy policy. Substantial costs which were formerly outside the market mechanism have, through the implementation of a series of taxes and regulations, been internalized to energy markets.[884]

Subsidies

* “Subsidies,” as defined by the U.S. Government Accountability Office, are “payments or benefits provided to encourage certain desired activities or behaviors.”[885] Per the U.S. Energy Information Administration (EIA), subsidies “stimulate the production or consumption of a commodity over what it would otherwise have been.”[886]

* EIA classifies government energy subsidies into two main categories: direct and indirect. Direct subsidies have explicit effects on government budgets, while indirect subsidies do not. For instance, tax breaks for the production of certain energy products are direct subsidies because they produce readily identifiable changes in tax revenues. In contrast, government mandates that require the use of certain energy products are indirect subsidies because the effects don’t appear as line items in government budgets, but they still impact energy consumers and producers.[887][888] [889]
* Reasons provided for enacting energy subsidies include but are not limited to:

  • promoting forms of energy that create less pollution or greenhouse gases.[890] [891]
  • correcting for the “energy paradox,” an “empirical observation that consumers require an abnormally high rate of return to undertake energy-efficiency investments.”[892]
  • increasing the stability of a nation’s energy supply by promoting domestic sources of energy over those controlled by hostile or unstable foreign governments.[893] [894]
  • paying energy bills for low-income households.[895]

* Ancillary consequences of government energy subsidies include but are not limited to:

  • increased energy costs,[896] [897] [898] [899] which reduce economic growth and leave people with less money “to satisfy basic needs for food, shelter, clothing, education, and health.”[900] [901]
  • increased energy consumption caused by lowering the price of energy at the point of sale (though not necessarily the overall cost), which decreases consumers’ incentive to conserve energy.[902] [903] [904]
  • increased food prices that augment hunger, particularly in poor nations.[905] [906] [907]
  • increased emissions of certain pollutants.[908]
  • increased taxes and/or government debts that exceed the benefits of the subsidies.[909] [910] [911] [912]
  • the government “paying firms or households to make choices about investment, production, or consumption that they would have made without the subsidies. For example, tax credits for energy-efficient windows might go to homeowners who would have purchased them anyway.”[913]
  • guaranteeing corporations double-digit profits on certain energy projects,[914] transferring the risks of their investments to the public,[915] and supplying them with funds used for executive bonuses shortly before they declare bankruptcy.[916]

* Forms of energy subsidies include but are not limited to:

  • giving money to producers and consumers of certain energy products.[917] [918]
  • offering preferential tax treatments to producers and consumers of certain energy products.[919] [920]
  • mandating that consumers and producers use specified amounts of certain energy products.[921] [922] [923][924]
  • purchasing through government agencies certain energy products that are significantly more expensive than other alternatives.[925] [926]
  • providing loans for energy projects that are unable to obtain private financing due to the risk of default, or guaranteeing to pay the loans in the event of default.[927] [928]
  • spending money on research and development for certain energy products.[929] [930]

* Examples of subsidies for:

  • coal include direct federal subsidies totaling $1.4 billion in 2010, with 49% of this going to the U.S. Department of Energy to conduct research primarily aimed at reducing greenhouse gas emissions.[931] [932] [933] Another 41% of these subsidies were for tax preferences, with 61% of this going to clean coal facilities and pollution control equipment.[934]
  • renewables in general include 679 federal initiatives that support solar, wind, biofuel, geothermal, hydropower, ocean, or waste conversion energy.[935] In 2010, direct federal subsidies for renewables amounted to $14.7 billion.[936] As an example of an indirect subsidy, thirty states and the District of Columbia require utilities to generate or obtain specified portions of their electricity from renewable sources.[937]
  • solar include direct federal subsidies including cash grants, tax preferences, research and development [R&D] expenses, and loan guarantees totaling $1.1 billion in 2010.[938] The states of California and Arizona have forced utilities to purchase electricity from customers with solar panels at rates that don’t account for the transmission or distribution costs of this energy. This pushes these costs, which amount to about 40% of the typical electricity bill, onto other customers.[939] [940] [941] [942] [943]
  • wind include direct federal subsidies totaling $5.0 billion in 2010, with 97% of this coming from the American Recovery and Reinvestment Act of 2009 (a.k.a. Obama stimulus).[944] The most prominent of these subsidies is a renewable energy tax credit/grant that is twice as high for wind, geothermal, and certain biofuels than it is for other renewable energy sources.[945] [946] [947]
  • biofuels include the EPA’s Renewable Fuel Standard program, which “generally requires the volume of biofuels used in the transportation sector … to increase through 2022 to an annual total of 36 billion gallons.”[948] (For a point of reference, the U.S. transportation sector consumed 99 billion gallons of gasoline in 2009.[949]) This subsidy was enacted to “encourage the domestic production of ethanol and other biofuels” and to reduce “greenhouse-gas emissions from the transportation sector.”[950]
  • natural gas and petroleum include direct federal subsidies totaling $2.8 billion in 2010, with 95% of this coming from tax preferences.[951] The largest of these (comprising 36% of the preferences) is called “percentage depletion,” a tax break on properties mined for natural resources such as oil, gas, coal, minerals, uranium, and geothermal steam. Since 1975, major oil and gas companies have been excluded from this tax preference, and the primary beneficiaries are small independent companies and property owners. The purpose of this subsidy is to maximize the yield of resources from each property.[952] [953] [954] [955] [956]
  • energy conservation/efficiency include direct federal subsidies totaling $6.6 billion in 2010, with 51% this going to cash payments and 49% to tax preferences. The largest of these (comprising 48% of total subsidies) is a tax preference for installing energy-efficient windows, furnaces, boilers, roofs, doors, etc. in existing homes.[957]
  • nuclear include direct federal subsidies totaling $2.5 billion in 2010, with 47% of this going to R&D. Of these R&D subsidies, the largest item (comprising 34% of total R&D subsidies) is for the environmental cleanup of government-sponsored nuclear research facilities. Although EIA classifies the environmental cleanup of “nuclear weapons development and government-sponsored nuclear energy research” facilities as subsidies for “non-defense environmental cleanup,” EIA has explained that these are not subsidies in the true sense of the word.[958] [959] [960] [961]

* As of May 2016, neither EIA nor the Congressional Budget Office (CBO) has published annual historical data providing a comprehensive and consistent measure of direct federal energy subsidies.[962] [963] [964] [965] EIA has published such data for certain years, although the level of detail varies, and definitions of what constitutes direct subsidies are not always consistent.[966] CBO has published data on federal energy-related tax preferences going back to 1977. These EIA and CBO data are reviewed below. They do not account for:

  • state and local subsidies.
  • federal indirect subsidies, such as mandates that force energy producers and consumers to use specified amounts of certain energy products, and federal agencies that purchase certain energy products that are more expensive than other alternatives.
  • federal tax preferences that are generally available to wide-ranging industries.
  • federal energy subsidies that have negligible value.[967] [968] [969] [970]

* Per EIA, energy subsidies in the range of one percent of total energy sales are “in general, too small to have a significant effect on the overall level of energy prices and consumption in the United States.”[971] Likewise, per EIA, “market impacts are negligible” for “programs that offer small subsidies for products for which there are huge existing markets….”[972]

Year

Direct Federal Energy Subsidies as

a Portion of Total Energy Sales

1990[973]

1-2%

1999[974]

0.7%

2007[975]

1.4%

2010[976]

3.1%

2013[977]

2.1%

* Energy tax preferences, unlike R&D subsidies, are “directly linked” to energy production, consumption or conservation, and individuals and corporations must take “specified actions” to receive these subsides.[978] [979]
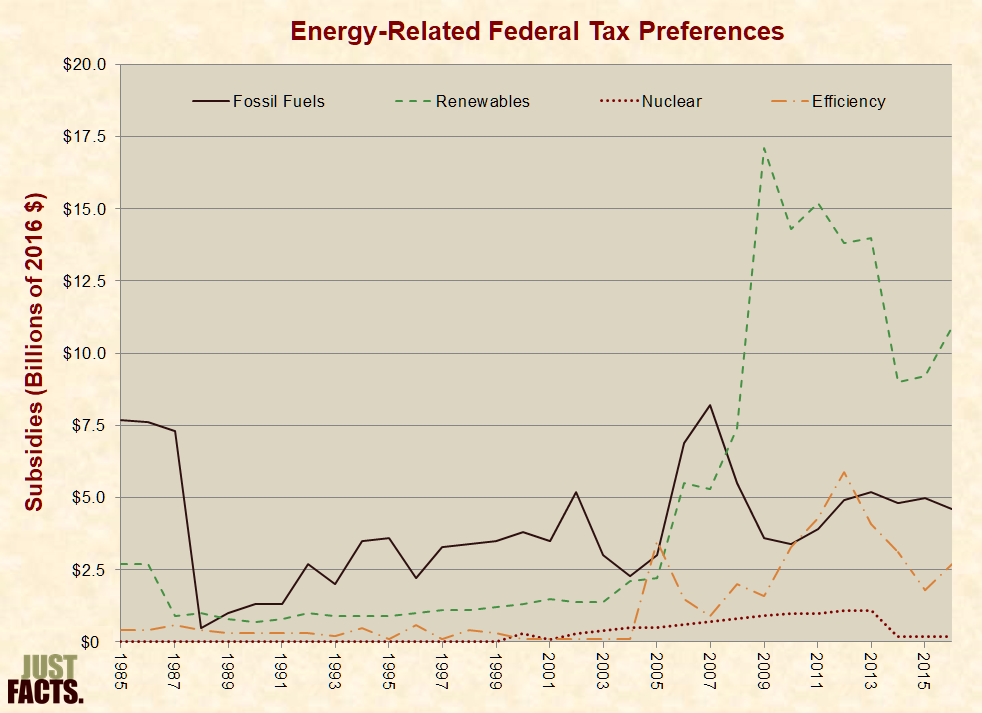
* From 1985 through 2015, inflation-adjusted federal tax preferences for:

  • fossil fuels averaged $3.9 billion per year.
  • renewables averaged $4.4 billion per year.
  • energy efficiency averaged $1.2 billion per year.
  • nuclear averaged $0.3 billion per year.[980]
 

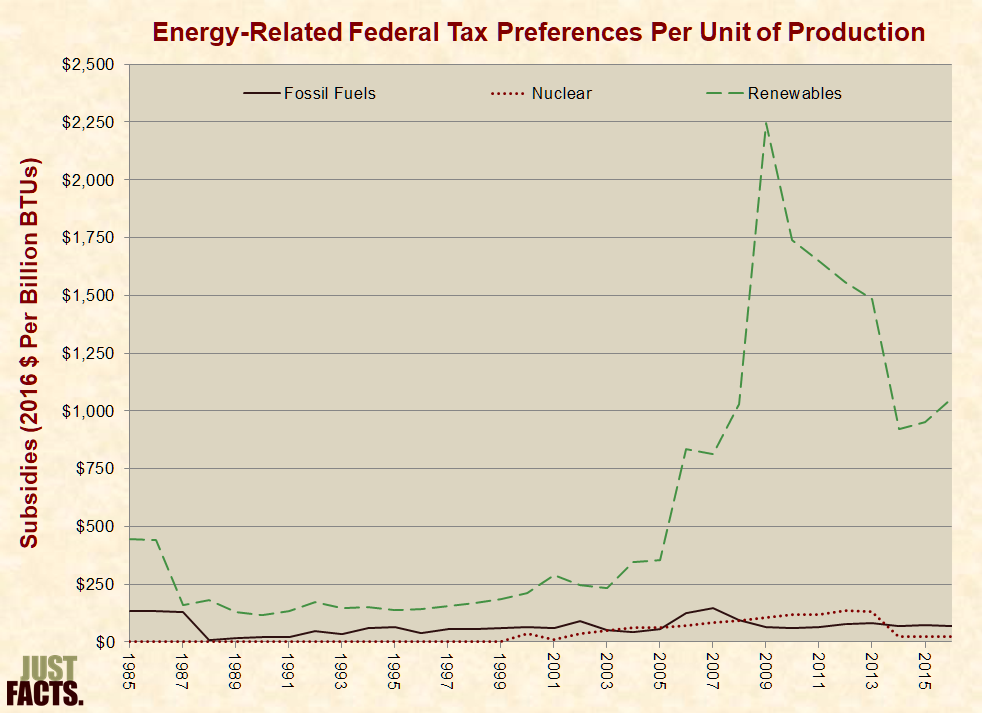
* Per EIA, “some forms of energy receive subsidies that are substantial relative to” the energy they produce, and thus, a “per-unit measure” of energy subsidies “may provide a better indicator of its market impact than an absolute measure.”[982] [983] For example, in 2010, coal received federal electricity production subsidies totaling $1,189 million, while solar received $968 billion.[984] However, coal produced 44.9% of the nation’s electricity, and solar produced 0.1%.[985] [986]
* From 1985 through 2015, federal tax preferences per unit of primary energy production for:

  • renewables averaged $563 per billion BTUs.
  • fossil fuels averaged $67 per billion BTUs.
  • nuclear averaged $38 per billion BTUs.[987]


* Aggregating energy subsidies into broad categories (like fossil fuels and renewables) can obscure their nature, because specific components of these broad categories sometimes receive relatively large portions of the subsidies. Per EIA, federal energy subsidies are often “targeted at narrow segments of the energy industry” and provide “relatively large payments to producers using specific energy technologies that otherwise would be uneconomical.”[989] [990] For example:

  • Under a previous federal subsidy enacted to ease dependence on foreign oil, “institutional investors such as insurance companies, banks, utilities, and large corporations with substantial net revenues” reduced their tax burdens by billions of dollars through a tax preference for “synthetic coal.” When this subsidy ended in 2007, “none of the 59 coal synthetic plants … remained profitable and all ceased production at the end of 2007.”[991][992] [993] [994] [995]
  • In 2012, the U.S. Navy procured 450,000 gallons of biofuels for its “Great Green Fleet” program. These fuels (made from used cooking oil and algae) cost $26.75 per gallon, while conventional fuel cost $3.60 per gallon.[996] [997] [998] [999]
  • In 2010, hydropower received 3% of all renewable electricity subsidies while producing 60% of all renewable electricity. In comparison, wind received 76% of all renewable electricity subsidies while producing 22% all renewable electricity, and solar received 15% of all renewable electricity subsidies while producing 0.6% of all renewable electricity.[1000]

* EIA has published comprehensive accountings of direct federal energy subsides for 1992, 1999, 2007, 2010, and 2013. Only the last three of these accountings disaggregate subsidies for specific renewables, like wind, solar, and biofuels.[1001] [1002] [1003] [1004] [1005] Combining this data with EIA’s primary energy production data reveals the following levels of per-unit energy subsidies:
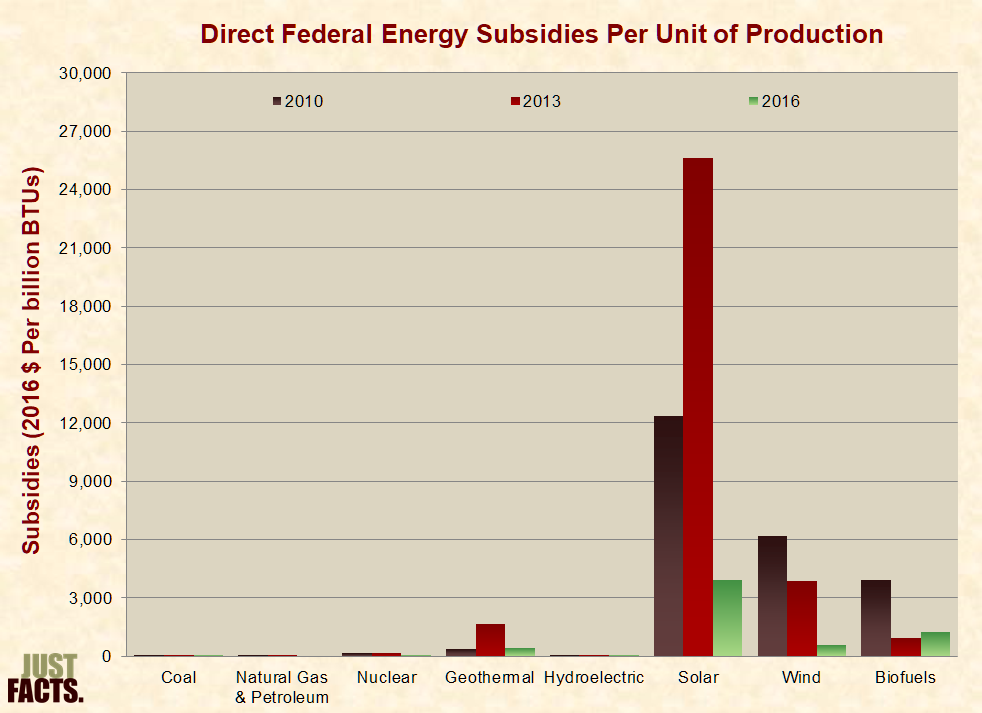
* Per EIA, there can be considerable lag times between subsidies and their effects on energy production. Thus, subsidies divided by production in any given year are not always representative of the larger picture. For example, many subsidies during 2007-2010 were provided to facilities still under construction as of 2011. Also, subsidies for research and development (R&D) of new technologies can take “many years” to yield results.[1007] However, EIA has noted that the outcomes of R&D subsidies are “inherently uncertain,” and:

  • “Several studies suggest that the return on overall Federal R&D investment is much lower than the return on private-sector R&D, implying relatively high failure rates.”
  • “Much of what is defined as energy R&D in the Federal government’s budget accounts is not directly expended on energy research or development. Rather, a portion of the funds are expended on environmental restoration and waste management associated with the byproducts of energy-related research facilities, e.g., nuclear waste disposal.” (Note that such subsidies are for government facilities; the owners of commercial nuclear power plants must pay for nuclear waste disposal.[1008] [1009])
  • “The creation of a Federally-funded R&D program could, under some circumstances, displace private-sector R&D. In that case, the Federal program would not produce new knowledge that could not be developed by the private sector, but would simply reduce private R&D costs.”[1010] [1011] [1012] [1013] [1014] [1015]

To be continued…….
Email this author

Posted in Energy | Comments Off on Energy Facts & Figures for Dummies Part X

Energy Facts & Figures for Dummies Part X

Share this article on:


(This is part X of this series on energy. We hope it helps the reader better understand the issues facing our country and our state as we endeavor to tackle the problem of providing our citizens and our businesses with their energy needs.)
COMPETING OBJECTIVES
* Choosing between different forms of energy often involves tradeoffs between competing objectives, such as affordability, environmental impacts, and energy security. These tradeoffs can sometimes be impossible to objectively quantify.[873] [874] [875] [876] [877]
* A 2008 Harris poll of 1,020 U.S. adults found that 92% favored “a large increase in the number of wind farms.”[878] The same poll found that among 787 U.S. adults who pay household energy bills:

  • 40% were not willing to pay anything more for energy from renewable sources.
  • 48% were willing to pay at least 5% more.
  • 31% were willing to pay at least 10% more.
  • 14% were willing to pay at least 15% more.
  • 7% were willing to pay at least 20% more.
  • 3% were willing to pay at least 30% more.
  • 1% were willing to pay at least 40% more.[879]

* In 2015, the U.S. Energy Information Administration (EIA) projected that the levelized cost of electricity generated by new onshore wind power in 2020 will be 1% higher than that from advanced combined cycle natural gas [Adv CC], and the cost of photovoltaic [PV] solar will be 73% higher than Adv CC.[880] Per EIA, these levelized costs “significantly understate the advantage of Adv CC relative to onshore wind … while overstating the advantage of Adv CC relative to solar PV….”[881] See the section above on the costs of electricity for extensive details about comparing the costs of electricity generating technologies.
* A 2010 Rasmussen poll of 1,000 likely voters found that:

  • 56% were not willing to pay more taxes or higher utility costs to “generate cleaner energy and fight global warming.”
  • 37% were willing to pay at least $100 more per year.
  • 18% were willing to pay at least $300 more per year.
  • 8% were willing to pay at least $500 more per year.
  • 5% were willing to pay at least $1,000 more per year.
  • 2% were willing to pay in excess of $1,000 more per year.[882]

* During 2015, the average cost of ethanol without federal subsidies was 38% higher than gasoline, and the average cost of biodiesel without federal subsidies was 118% higher than gasoline.[883]
* Per a 1992 EIA report:

Much current debate on energy policy focuses on externalities associated with energy use. Many believe there is a large implicit subsidy to energy production and consumption insofar as pollution results in environmental costs not fully charged to those responsible. …
In fact, the effort to deal with environmental concerns has become a central feature of Federal energy policy. Substantial costs which were formerly outside the market mechanism have, through the implementation of a series of taxes and regulations, been internalized to energy markets.[884]

Subsidies

* “Subsidies,” as defined by the U.S. Government Accountability Office, are “payments or benefits provided to encourage certain desired activities or behaviors.”[885] Per the U.S. Energy Information Administration (EIA), subsidies “stimulate the production or consumption of a commodity over what it would otherwise have been.”[886]

* EIA classifies government energy subsidies into two main categories: direct and indirect. Direct subsidies have explicit effects on government budgets, while indirect subsidies do not. For instance, tax breaks for the production of certain energy products are direct subsidies because they produce readily identifiable changes in tax revenues. In contrast, government mandates that require the use of certain energy products are indirect subsidies because the effects don’t appear as line items in government budgets, but they still impact energy consumers and producers.[887][888] [889]
* Reasons provided for enacting energy subsidies include but are not limited to:

  • promoting forms of energy that create less pollution or greenhouse gases.[890] [891]
  • correcting for the “energy paradox,” an “empirical observation that consumers require an abnormally high rate of return to undertake energy-efficiency investments.”[892]
  • increasing the stability of a nation’s energy supply by promoting domestic sources of energy over those controlled by hostile or unstable foreign governments.[893] [894]
  • paying energy bills for low-income households.[895]

* Ancillary consequences of government energy subsidies include but are not limited to:

  • increased energy costs,[896] [897] [898] [899] which reduce economic growth and leave people with less money “to satisfy basic needs for food, shelter, clothing, education, and health.”[900] [901]
  • increased energy consumption caused by lowering the price of energy at the point of sale (though not necessarily the overall cost), which decreases consumers’ incentive to conserve energy.[902] [903] [904]
  • increased food prices that augment hunger, particularly in poor nations.[905] [906] [907]
  • increased emissions of certain pollutants.[908]
  • increased taxes and/or government debts that exceed the benefits of the subsidies.[909] [910] [911] [912]
  • the government “paying firms or households to make choices about investment, production, or consumption that they would have made without the subsidies. For example, tax credits for energy-efficient windows might go to homeowners who would have purchased them anyway.”[913]
  • guaranteeing corporations double-digit profits on certain energy projects,[914] transferring the risks of their investments to the public,[915] and supplying them with funds used for executive bonuses shortly before they declare bankruptcy.[916]

* Forms of energy subsidies include but are not limited to:

  • giving money to producers and consumers of certain energy products.[917] [918]
  • offering preferential tax treatments to producers and consumers of certain energy products.[919] [920]
  • mandating that consumers and producers use specified amounts of certain energy products.[921] [922] [923][924]
  • purchasing through government agencies certain energy products that are significantly more expensive than other alternatives.[925] [926]
  • providing loans for energy projects that are unable to obtain private financing due to the risk of default, or guaranteeing to pay the loans in the event of default.[927] [928]
  • spending money on research and development for certain energy products.[929] [930]

* Examples of subsidies for:

  • coal include direct federal subsidies totaling $1.4 billion in 2010, with 49% of this going to the U.S. Department of Energy to conduct research primarily aimed at reducing greenhouse gas emissions.[931] [932] [933] Another 41% of these subsidies were for tax preferences, with 61% of this going to clean coal facilities and pollution control equipment.[934]
  • renewables in general include 679 federal initiatives that support solar, wind, biofuel, geothermal, hydropower, ocean, or waste conversion energy.[935] In 2010, direct federal subsidies for renewables amounted to $14.7 billion.[936] As an example of an indirect subsidy, thirty states and the District of Columbia require utilities to generate or obtain specified portions of their electricity from renewable sources.[937]
  • solar include direct federal subsidies including cash grants, tax preferences, research and development [R&D] expenses, and loan guarantees totaling $1.1 billion in 2010.[938] The states of California and Arizona have forced utilities to purchase electricity from customers with solar panels at rates that don’t account for the transmission or distribution costs of this energy. This pushes these costs, which amount to about 40% of the typical electricity bill, onto other customers.[939] [940] [941] [942] [943]
  • wind include direct federal subsidies totaling $5.0 billion in 2010, with 97% of this coming from the American Recovery and Reinvestment Act of 2009 (a.k.a. Obama stimulus).[944] The most prominent of these subsidies is a renewable energy tax credit/grant that is twice as high for wind, geothermal, and certain biofuels than it is for other renewable energy sources.[945] [946] [947]
  • biofuels include the EPA’s Renewable Fuel Standard program, which “generally requires the volume of biofuels used in the transportation sector … to increase through 2022 to an annual total of 36 billion gallons.”[948] (For a point of reference, the U.S. transportation sector consumed 99 billion gallons of gasoline in 2009.[949]) This subsidy was enacted to “encourage the domestic production of ethanol and other biofuels” and to reduce “greenhouse-gas emissions from the transportation sector.”[950]
  • natural gas and petroleum include direct federal subsidies totaling $2.8 billion in 2010, with 95% of this coming from tax preferences.[951] The largest of these (comprising 36% of the preferences) is called “percentage depletion,” a tax break on properties mined for natural resources such as oil, gas, coal, minerals, uranium, and geothermal steam. Since 1975, major oil and gas companies have been excluded from this tax preference, and the primary beneficiaries are small independent companies and property owners. The purpose of this subsidy is to maximize the yield of resources from each property.[952] [953] [954] [955] [956]
  • energy conservation/efficiency include direct federal subsidies totaling $6.6 billion in 2010, with 51% this going to cash payments and 49% to tax preferences. The largest of these (comprising 48% of total subsidies) is a tax preference for installing energy-efficient windows, furnaces, boilers, roofs, doors, etc. in existing homes.[957]
  • nuclear include direct federal subsidies totaling $2.5 billion in 2010, with 47% of this going to R&D. Of these R&D subsidies, the largest item (comprising 34% of total R&D subsidies) is for the environmental cleanup of government-sponsored nuclear research facilities. Although EIA classifies the environmental cleanup of “nuclear weapons development and government-sponsored nuclear energy research” facilities as subsidies for “non-defense environmental cleanup,” EIA has explained that these are not subsidies in the true sense of the word.[958] [959] [960] [961]

* As of May 2016, neither EIA nor the Congressional Budget Office (CBO) has published annual historical data providing a comprehensive and consistent measure of direct federal energy subsidies.[962] [963] [964] [965] EIA has published such data for certain years, although the level of detail varies, and definitions of what constitutes direct subsidies are not always consistent.[966] CBO has published data on federal energy-related tax preferences going back to 1977. These EIA and CBO data are reviewed below. They do not account for:

  • state and local subsidies.
  • federal indirect subsidies, such as mandates that force energy producers and consumers to use specified amounts of certain energy products, and federal agencies that purchase certain energy products that are more expensive than other alternatives.
  • federal tax preferences that are generally available to wide-ranging industries.
  • federal energy subsidies that have negligible value.[967] [968] [969] [970]

* Per EIA, energy subsidies in the range of one percent of total energy sales are “in general, too small to have a significant effect on the overall level of energy prices and consumption in the United States.”[971] Likewise, per EIA, “market impacts are negligible” for “programs that offer small subsidies for products for which there are huge existing markets….”[972]

Year

Direct Federal Energy Subsidies as

a Portion of Total Energy Sales

1990[973]

1-2%

1999[974]

0.7%

2007[975]

1.4%

2010[976]

3.1%

2013[977]

2.1%

* Energy tax preferences, unlike R&D subsidies, are “directly linked” to energy production, consumption or conservation, and individuals and corporations must take “specified actions” to receive these subsides.[978] [979]
* From 1985 through 2015, inflation-adjusted federal tax preferences for:

  • fossil fuels averaged $3.9 billion per year.
  • renewables averaged $4.4 billion per year.
  • energy efficiency averaged $1.2 billion per year.
  • nuclear averaged $0.3 billion per year.[980]
 

* Per EIA, “some forms of energy receive subsidies that are substantial relative to” the energy they produce, and thus, a “per-unit measure” of energy subsidies “may provide a better indicator of its market impact than an absolute measure.”[982] [983] For example, in 2010, coal received federal electricity production subsidies totaling $1,189 million, while solar received $968 billion.[984] However, coal produced 44.9% of the nation’s electricity, and solar produced 0.1%.[985] [986]
* From 1985 through 2015, federal tax preferences per unit of primary energy production for:

  • renewables averaged $563 per billion BTUs.
  • fossil fuels averaged $67 per billion BTUs.
  • nuclear averaged $38 per billion BTUs.[987]


* Aggregating energy subsidies into broad categories (like fossil fuels and renewables) can obscure their nature, because specific components of these broad categories sometimes receive relatively large portions of the subsidies. Per EIA, federal energy subsidies are often “targeted at narrow segments of the energy industry” and provide “relatively large payments to producers using specific energy technologies that otherwise would be uneconomical.”[989] [990] For example:

  • Under a previous federal subsidy enacted to ease dependence on foreign oil, “institutional investors such as insurance companies, banks, utilities, and large corporations with substantial net revenues” reduced their tax burdens by billions of dollars through a tax preference for “synthetic coal.” When this subsidy ended in 2007, “none of the 59 coal synthetic plants … remained profitable and all ceased production at the end of 2007.”[991][992] [993] [994] [995]
  • In 2012, the U.S. Navy procured 450,000 gallons of biofuels for its “Great Green Fleet” program. These fuels (made from used cooking oil and algae) cost $26.75 per gallon, while conventional fuel cost $3.60 per gallon.[996] [997] [998] [999]
  • In 2010, hydropower received 3% of all renewable electricity subsidies while producing 60% of all renewable electricity. In comparison, wind received 76% of all renewable electricity subsidies while producing 22% all renewable electricity, and solar received 15% of all renewable electricity subsidies while producing 0.6% of all renewable electricity.[1000]

* EIA has published comprehensive accountings of direct federal energy subsides for 1992, 1999, 2007, 2010, and 2013. Only the last three of these accountings disaggregate subsidies for specific renewables, like wind, solar, and biofuels.[1001] [1002] [1003] [1004] [1005] Combining this data with EIA’s primary energy production data reveals the following levels of per-unit energy subsidies:

* Per EIA, there can be considerable lag times between subsidies and their effects on energy production. Thus, subsidies divided by production in any given year are not always representative of the larger picture. For example, many subsidies during 2007-2010 were provided to facilities still under construction as of 2011. Also, subsidies for research and development (R&D) of new technologies can take “many years” to yield results.[1007] However, EIA has noted that the outcomes of R&D subsidies are “inherently uncertain,” and:

  • “Several studies suggest that the return on overall Federal R&D investment is much lower than the return on private-sector R&D, implying relatively high failure rates.”
  • “Much of what is defined as energy R&D in the Federal government’s budget accounts is not directly expended on energy research or development. Rather, a portion of the funds are expended on environmental restoration and waste management associated with the byproducts of energy-related research facilities, e.g., nuclear waste disposal.” (Note that such subsidies are for government facilities; the owners of commercial nuclear power plants must pay for nuclear waste disposal.[1008] [1009])
  • “The creation of a Federally-funded R&D program could, under some circumstances, displace private-sector R&D. In that case, the Federal program would not produce new knowledge that could not be developed by the private sector, but would simply reduce private R&D costs.”[1010] [1011] [1012] [1013] [1014] [1015]

To be continued…….
Email this author

Posted in Energy | Comments Off on Energy Facts & Figures for Dummies Part X

Cigarette Taxes Do Not Usually Produce Projected Income

Share this article on:

taxesTaxes are a funny thing.  They can’t be relied on to produce the amount of money governments hope to collect from those who pay.  Over and over again, it has become reality that in most cases the more government taxes something, the less that government receives in the long-run from those taxes.

This was again proven in a recent study by the Thomas Jefferson Institute when it looked at the reality of cities and towns here in Virginia that have increased the cigarette tax.  That study,  Fiscal Impact of Cigarette Tax Increases on Virginia’s Municipalities, uses data published by local jurisdictions as part of their budget process and shows that municipal cigarette tax collections have been flat or falling since FY 2010; that tax hikes increase revenues by less than municipal budget projections would imply; and that tax revenue collection increases are usually fleeting, often turning flat or negative in the years following a tax increase.
This study was done to see if “sin taxes” such as those on cigarettes truly produced the income that local governments hoped would be the case.  In most cases these taxes fell short and, in some cases, produced even less than had been the case before taxes were raised.  Rarely did these particular tax increases bring in more money than projected and in most cases much less. 
Municipal governments relying on increased cigarette taxes to help balance their budgets usually see those projections disappear in a puff of smoke.  This is clearly the case as this new study shows. 
And this study also indicates that these cigarette tax increases are changing consumers’ buying patterns: smokers oftentimes cross over the border to a nearby town or county that has lower taxes and lower prices.  And when a smoker goes to another jurisdiction to buy a carton of cigarettes, that person usually buys others consumer items as well.  That might be only a soda at a convenience store, or it might be the week’s groceries at the super market.  When several dollars can be saved on a carton of cigarettes, it is not hard to believe that the shopper looking for bargains or carrying “food coupons” with him or her will also seek savings on their cigarettes.
The Town of Vinton is the starkest example of this trend. In 2014 Vinton doubled its cigarette tax. But instead of meeting its budget projection of a 43 percent increase in tax revenue, cigarette tax revenues plunged by 17 percent as smokers drove elsewhere to make their purchases.
Worse yet, these taxes hurt that town’s small business community, resulting in the loss of two retailers and the opening of a cigarette outlet just outside the Town limits. This results in a further loss of revenue to the town through reduced sales taxes.
Last month’s election saw three out of four meals tax proposals defeated by an average 57 percent – even in areas where Hillary Clinton garnered 64 percent of the vote. These results demonstrated that Virginians have a high resistance to increased taxes, and when it comes to cigarette taxes, this new study shows that consumers will ‘vote with their feet’ by crossing the border to purchase cigarettes and others items elsewhere.
As municipalities begin the process of developing their budgets for next year, instead of seeking tax increases whose effect can, in most cases, be temporary or even negative, they might be better advised to seek efficiencies in their operations or policies that encourage economic growth rather that those that push business out of the area.
One city that is talking about raising cigarette taxes is Richmond.  This issue became part of its recent mayoral election rhetoric.  As the new mayor considers a budget for next year, he might want to read this new analysis.  A good review of this study ran in the Richmond Times Dispatch and can be found here.
This study was conducted by the Beacon Hill Institute in Boston, Massachusetts, which is currently a part of Suffolk University but will become a self-standing, independent institute on January 1, 2017.  We hope it is helpful to cities and towns as they craft their budgets for next year and think about how to build a stronger economic base in their communities for the future.
Email this author

Posted in Taxes | Comments Off on Cigarette Taxes Do Not Usually Produce Projected Income