Federal Government Lays An Egg

Share this article on:

cracked-egg-150x150In May 2016, a congressman from Michigan wrote a stinging letter to Secretary of Agriculture Tom Vilsack. Twenty four Republican members of Congress complained about a new proposed rule regarding practices for organic poultry and livestock. The proposed rule for poultry and livestock practices can be found in the Federal Register April 13, 2016. The comment period for this rule closed July 13.
The congressmen claim that USDA and the Agricultural Marketing Service (AMS) are “…advocating a [proposed] rule that many of these businesses [can] not comply with. AMS even acknowledges this in the summary of the proposed rule wherein the agency reports that outdoor access measures would lead to a reduction of 43% of current organic layers – and says that up to 90% of organic aviaries would exit to the cage free market.”
The Congressional letter raises numerous questions regarding what AMS is thinking. An examination of the proposed rule for an organic poultry operation is a masterpiece in terms of government requirements for production agriculture.
In a section entitled “Avian Living Conditions” AMS tells the producer of organic poultry that the operation “…must establish and maintain year-round poultry living conditions which accommodate the health and natural behavior of poultry, including: year-round access to outdoors; shade; shelter; exercise areas; fresh air; direct sunlight; clean water for drinking; materials for dust bathing; and adequate outdoor space to escape from predators and aggressive behaviors suitable to the species, its stage of life, the climate and the environment.” (I suspect foxes and coyotes will love the additional outdoor space.)
Requirements for organic poultry operations are even more amusing when applied to indoor space requirements for poultry. Indoor housing “…must have 30% minimum of solid floor area available with sufficient litter available for dust baths so that birds may freely dust bathe without crowding.”
At least there is no requirement for curtains for privacy!
The new outdoor space requirements are enlightening as well. “Producers must provide access to the outdoors at an early age to encourage (train) birds to go outdoors. Outdoor areas must have suitable enrichment to entice birds to go outside.” In going outside, the AMS regulators have determined that “Exit areas for birds to get outside must be designed so that more than one bird at a time can get through the opening and that all birds within the house can go through the exit areas within one hour.”
The AMS bureaucrats also declare space that has a solid roof overhead and allows poultry to remain under it without hindrance does not meet the definition of outdoor access. The only shade allowable for the precious organic creatures must “…be provided by structures, trees or other objects in the environment.”
Finally, the producer of an organic poultry operation is also directed and mandated how to manage manure. Organic poultry manure must be managed “…in a manner that does not contribute to contamination of crops, soil, or water by plant nutrients, heavy metals, or pathogenic organisms and optimizes recycling of nutrients and must manage outdoor access in a manner that does not put soil or water quality at risk.”
These are but just a few new proposed requirements that AMS would require for organic poultry production, which includes chickens, turkeys, geese, quail, pheasant, and any other specie which will be raised for organic eggs, meat, or other organic agricultural product.
USDA and AMS are certainly expanding their power.
(This article first ran in Farm Futures on July 25, 2016)

Email this author

Posted in Agriculture, Latest | Comments Off on Federal Government Lays An Egg

Energy Facts & Figures for Dummies Part I

Share this article on:

(Editor’s note: Just Facts is a neat publication that has produced some very worthwhile information that we have shared with the readers of the Jefferson Policy Journal over the years.  Its newest research deals with the facts of energy and will be reprinted here over the next several issues.  There are pages and pages of footnotes and if a reader would like these, please email me and I will gladly send you the link to them.  They are simply too numerous to reprint in this public policy journal. I hope you enjoy this series.)
Introductory Notes
In keeping with Just Facts’ Standards of Credibility, all graphs show the full range of available data, and all facts are cited based upon availability and relevance, not to slant results by singling out specific years that are different from others.
Science and Economics
Basic Science

  • “Energy,” as defined by the Oxford Dictionary of Biochemistry and Molecular Biology, is “the capacity of a system for doing work.”
  • Energy can take varying forms, such as thermal, electrical, mechanical, nuclear, chemical, gravitational, acoustic, and electromagnetic.
  • Two common measures of energy are British thermal units (Btu) and joules. All forms of energy can be expressed in these units. One Btu is the amount of energy needed to raise the temperature of one pound of water from 39 to 40 degrees Fahrenheit.One joule is the amount of energy needed to lift one hundred grams (3.5 ounces) upward by one meter (3.3 feet) while on the surface of the earth.[6]
  • As a consequence of the First Law of Thermodynamics, energy and matter cannot be created or destroyed; they can only be transformed from one form into another.[7] [8] [9] [10]
  • As a consequence of the Second Law of Thermodynamics, when energy is transformed from one form to another, some of it disperses, thus making it less useful for performing work. [11] [12] [12] [14]

  • just-facts-energy 150Practical Uses 

    • Humans have learned to harness energy to accomplish tasks such as transporting people and products, heating and cooling homes, farming, cooking, manufacturing goods, communicating across vast distances, and generating light. [15]
    • The average annual energy consumption in the U.S. is 309,000,000 Btu per person. To generate this amount of energy through physical human effort (like pedaling bicycles to drive generators) would require 208 people working nonstop for a year. [16]
    • “Embodied energy” refers to the energy used in making materials. For example, to make a common clay brick weighing 5 pounds requires about 5,386 Btu of energy. The materials of a typical house embody about 850 million Btu, which is equivalent to the energy that would be generated by 573 people pedaling bicycles nonstop for a year. [17]

    Economic Impacts

    • In 2013, energy expenditures in the U.S. were 8.3% of gross domestic product (GDP), or $1.4 trillion ($1,383,045,600,000).[18] In inflation-adjusted 2015 dollars,[19] this amounts to $4,446 for every U.S. resident or $11,491 per household.[20] [21]
Energy Spending as a Share of GDP

[22]

The costs of most products are affected by the costs of energy, even products with low embodied energies because the costs of energy affect the costs of transporting products. Because energy costs influence the costs of products, higher energy costs tend to drive up unemployment, drive down wages, and cause other negative economic effects. Such consequences tend to be harsher in poorer nations.[23] [24] [25]
Roughly one third of the world’s population does not have access to modern forms of energy. In these areas, people use biomass (primarily wood) for about 80% of their energy, and women and children spend an average of 9-12 hours a week collecting firewood. Per the Institute for Plasma Physics in the Netherlands:
Poor people spend a large part of their time collecting the energy they need. This time cannot be spent in producing things that can be sold, working on the land, or learning. This is called the poverty trap: once you are poor, it is very hard to get out of poverty again, because you need to spend all your time in survival activities. This normally leaves very little time to do things that might get you out of poverty, like education, or production of goods to sell on the market.[26] [27]

  • Higher energy costs drive up the costs of food.[28] This has greater impacts on poorer nations and individuals because they spend a larger portion of their income on food.[29] [30] In Haiti during 2007 and 2008, higher energy prices contributed to increased food prices, driving Haiti’s poorer people to obtain nourishment from cookies made of mud.[31]
  • Per the Congressional Research Service, “The economic well-being and economic security of the nation depends on having stable energy sources.”[32]
  • Per the U.S. Government Accountability Office, “Americans’ daily lives, as well as the economic productivity of the United States, depend on the availability of energy….”[33]
  • Per the textbook Introduction to Air Pollution Science, “The availability of affordable electric power is essential for public health and economic prosperity.”[34]

Per the U.S. Energy Information Administration:

  • “Liquid fuels play a vital role in the U.S. energy system and economy, and access to affordable liquid fuels has contributed to the nation’s economic prosperity.”
  • “Cheaper energy allows the economy to expand further….”
  • “increasing energy production has immediate benefits for the economy.”[35] [36]
  • Per the textbook Microeconomics for Today, countries with slower economic growth “are less able to satisfy basic needs for food, shelter, clothing, education, and health.”[37]

U.S. Energy Supplies

During 2015:

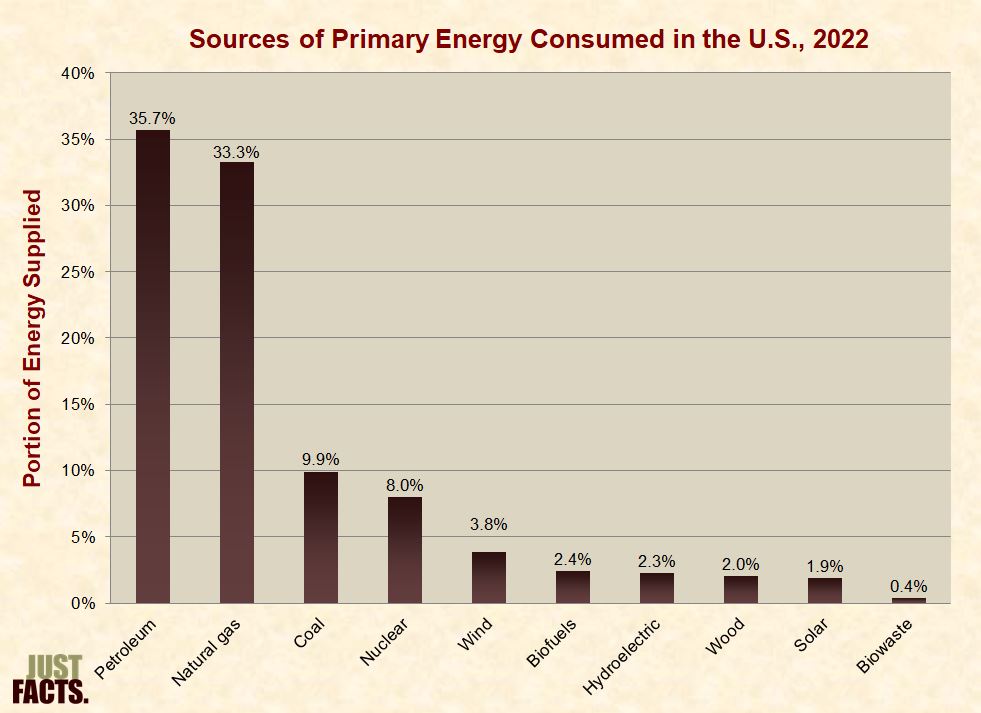
  • Petroleum supplied 36.2% of all primary energy consumed in the U.S.
  • Natural gas supplied 29.0%.
  • Coal supplied 16.1%.
  • Nuclear supplied 8.5%.
  • Hydroelectric supplied 2.4%.
  • Biofuels supplied 2.2%.
  • Wood supplied 2.1%.
  • Wind supplied 1.9%.
  • Solar supplied 0.5%.
  • Biowaste supplied 0.5%.
  • Geothermal supplied 0.2%.[38]
Sources of Primary Energy

[39]

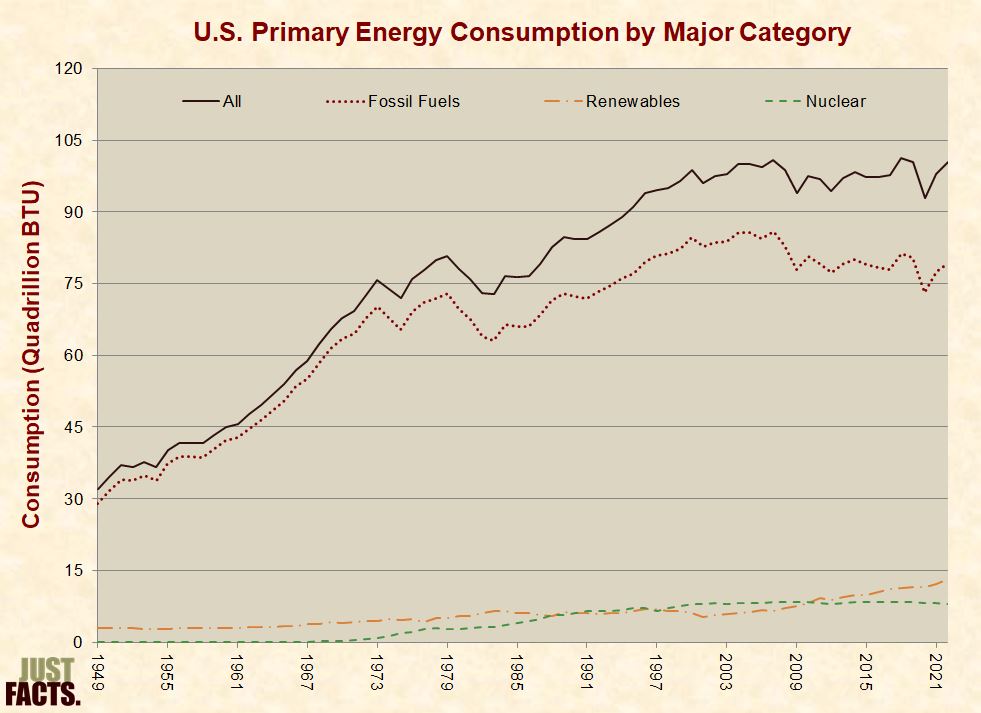
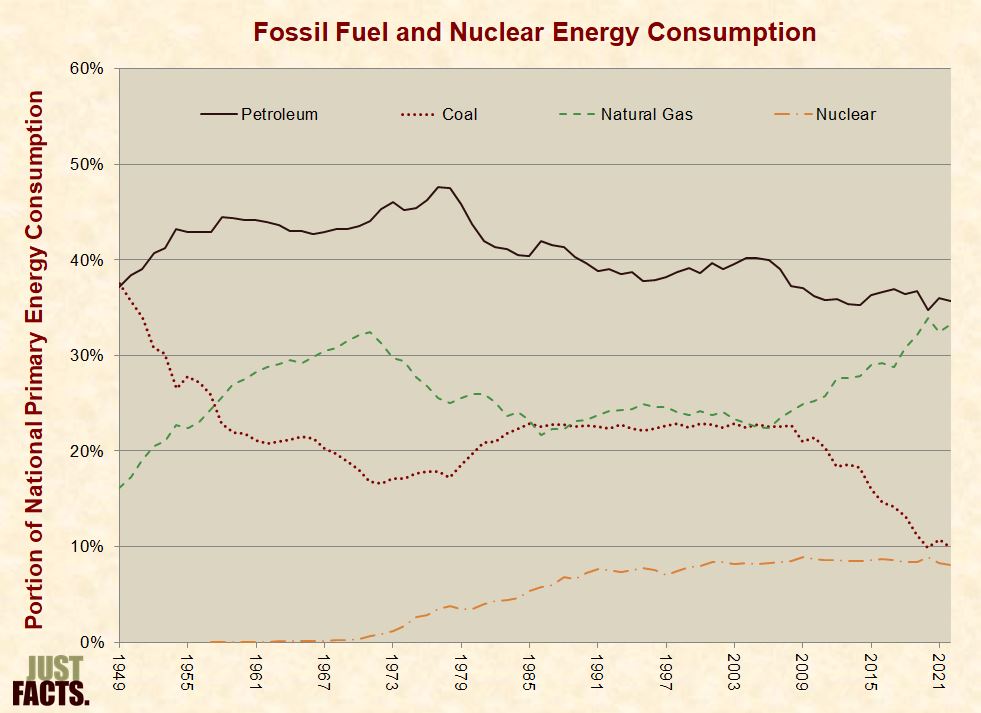
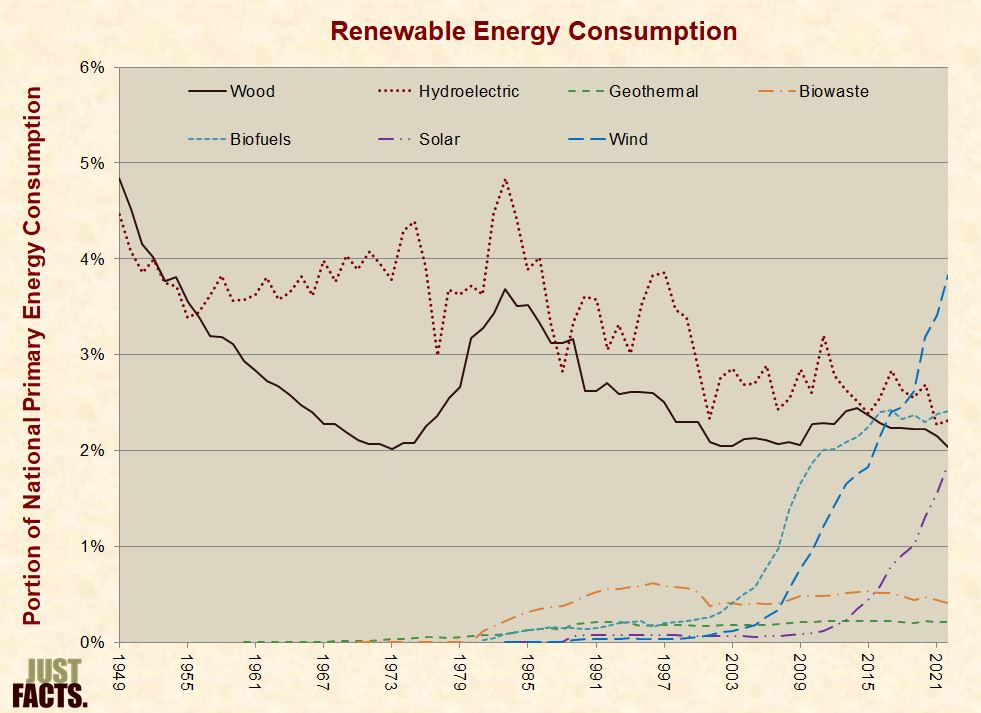
  • The following graphs show the components of U.S. energy consumption over time. The first graph shows consumption measured in BTUs. The rest show consumption measured as a portion of total U.S. energy consumption. Each succeeding graph uses a smaller scale to provide increasing resolution.
  • The following graphs show the components of U.S. energy consumption over time. The first graph shows consumption measured in BTUs. The rest show consumption measured as a portion of total U.S. energy consumption. Each succeeding graph uses a smaller scale to provide increasing resolution.
Primary Energy Consumption

[40] [41] [42]

Fossil Fuel and Nuclear Energy Consumption

[43]

Renewable Energy Consumption

[44]

Low-Production Renewable Energy Consumption

[45]

* Data from the graphs above:

Components of U.S. Energy Consumption

Source

1950

1960

1970

1980

1990

2000

2010

2015

Petroleum

38.5%

44.2%

43.5%

43.8%

39.7%

38.7%

36.4%

36.2%

Natural Gas

17.2%

27.5%

32.1%

25.9%

23.2%

24.1%

25.2%

29.0%

Coal

35.7%

21.8%

18.1%

19.8%

22.7%

22.8%

21.4%

16.1%

Nuclear

0.0%

0.0%

0.4%

3.5%

7.2%

8.0%

8.7%

8.5%

Hydroelectric

4.1%

3.6%

3.9%

3.7%

3.6%

2.8%

2.6%

2.4%

Biofuels

N/A

N/A

N/A

N/A

0.1%

0.2%

1.9%

2.2%

Wood

4.5%

2.9%

2.1%

3.2%

2.6%

2.3%

2.0%

2.1%

Wind

N/A

N/A

N/A

N/A

0.0%

0.1%

0.9%

1.9%

Biowaste

N/A

N/A

0.0%

0.0%

0.5%

0.5%

0.5%

0.5%

Geothermal

N/A

0.0%

0.0%

0.1%

0.2%

0.2%

0.2%

0.2%

Solar

N/A

N/A

N/A

N/A

0.1%

0.1%

0.1%

0.5%

[46]


Sectors & Electricity

  • The U.S. Energy Information Administration (EIA) divides the energy market into four major sectors: residential,[47] commercial,[48] transportation,[49] and industrial.[50] [51]
  • In 2014, the residential sector consumed 22% of all U.S. energy, the commercial sector consumed 18%, the transportation sector consumed 28%, and the industrial sector consumed 32%.[52]
  • EIA sometimes classifies “electric power” as separate sector,[53] although the electricity produced by this sector is consumed by the four major sectors.[54]
  • In 2014, the electric power sector consumed 39% of all U.S. energy.[55]
  • Per the Institute for Plasma Physics in the Netherlands:
  • “Electricity is the most flexible form of energy: it can be used for virtually any application.”
  • Using electricity to generate heat “is normally much more expensive than using fossil fuels, and it is only used for relatively small amounts of heat.”
  • “Electricity is also quite hard to store in large quantities. You need large, heavy batteries to store a reasonable amount of electrical energy.”
  • “The central generation of electricity means it has to be distributed over the country in order to bring it to your house. This causes an average loss of energy of 10%, and needs a large and expensive distribution system.”[56]

* During 2015:

  • Coal generated 33.2% of all electricity produced in the U.S.
  • Natural gas generated 32.7%.
  • Nuclear generated 19.5%.
  • Hydroelectric generated 6.0%.
  • Wind generated 4.7%.
  • Wood generated 1.0%.
  • Solar generated 0.9%.
  • Petroleum generated 0.7%.
  • Biomass (other than wood) generated 0.5%.
  • Geothermal generated 0.4%.[57]
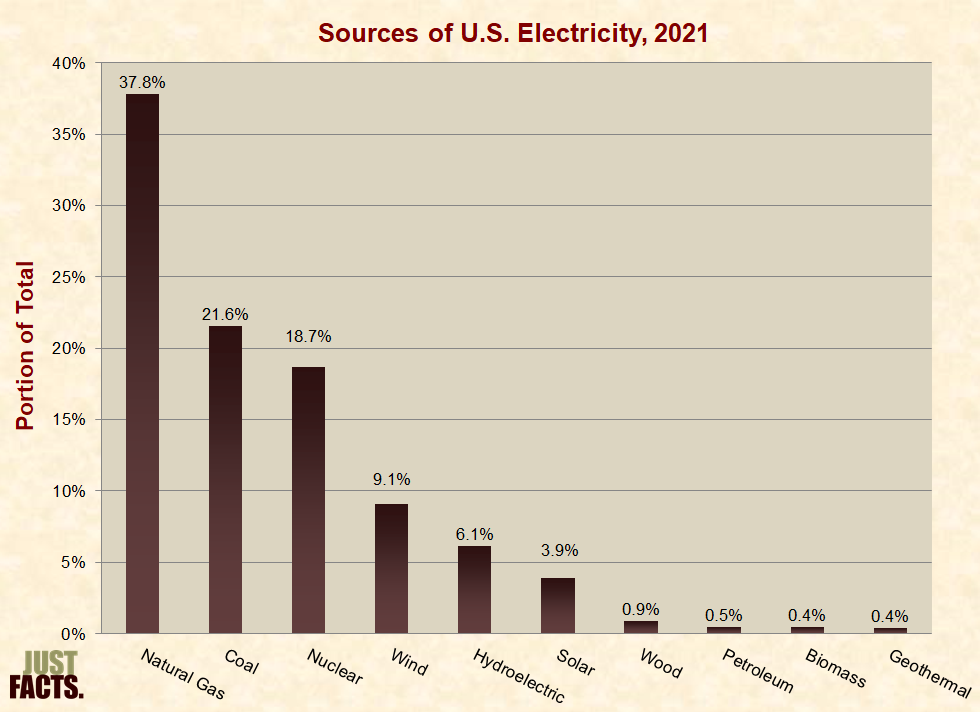
Sources of U.S. Electricity

[58]

Economic growth is a key factor in the growth of electricity generation.[59]
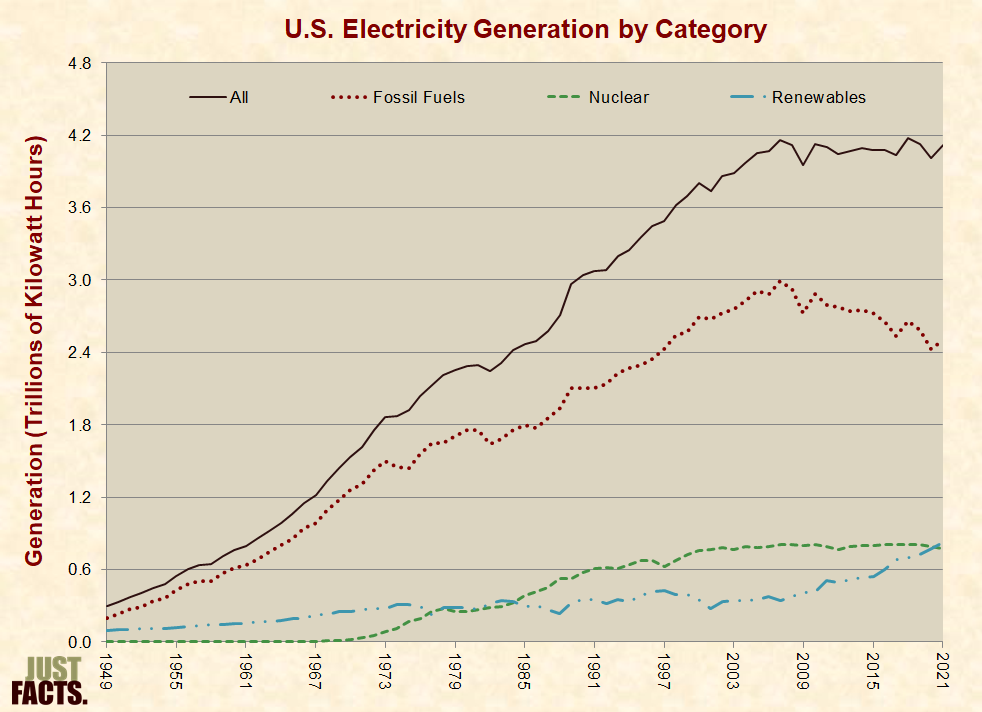
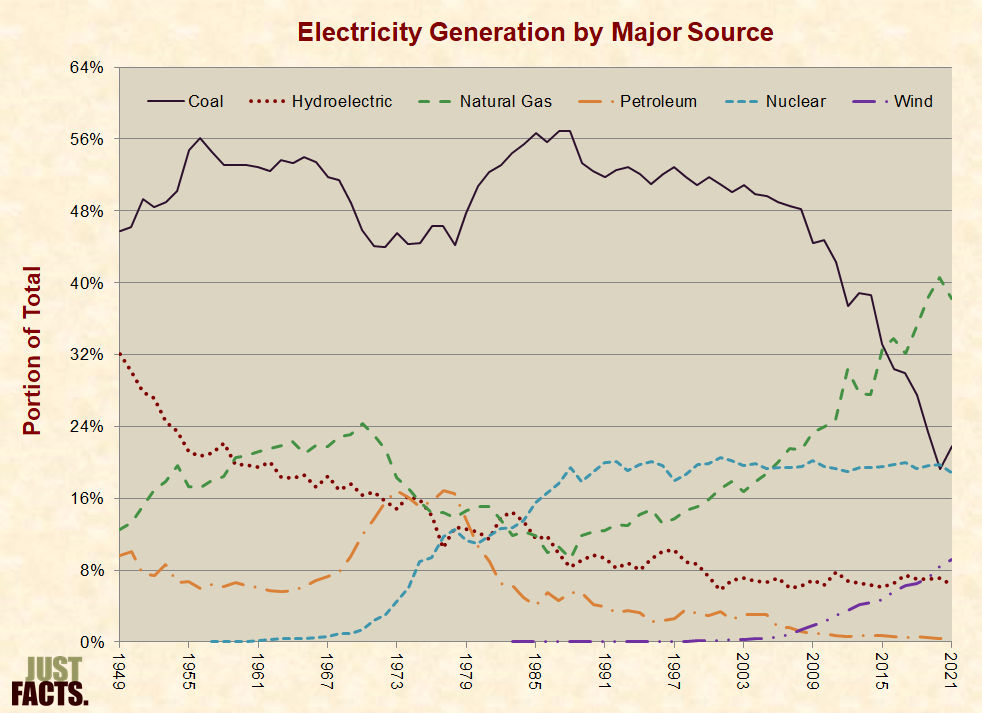
The following graphs show the components of U.S. electricity generation over time. The first graph shows generation measured in kilowatt hours. The rest show generation measured as a portion of total U.S. electricity generation. Each succeeding graph uses a smaller scale to provide increasing resolution.

U.S. Electricity Generation by Category

[60]

Electricity Generation by Major Source

[61]

Electricity Generation by Minor Source

[62]

(To be continued)

Email this author

Posted in Energy | Comments Off on Energy Facts & Figures for Dummies Part I

Energy Facts & Figures for Dummies Part I

Share this article on:

(Editor’s note: Just Facts is a neat publication that has produced some very worthwhile information that we have shared with the readers of the Jefferson Policy Journal over the years.  Its newest research deals with the facts of energy and will be reprinted here over the next several issues.  There are pages and pages of footnotes and if a reader would like these, please email me and I will gladly send you the link to them.  They are simply too numerous to reprint in this public policy journal. I hope you enjoy this series.)
Introductory Notes
In keeping with Just Facts’ Standards of Credibility, all graphs show the full range of available data, and all facts are cited based upon availability and relevance, not to slant results by singling out specific years that are different from others.
Science and Economics
Basic Science

  • “Energy,” as defined by the Oxford Dictionary of Biochemistry and Molecular Biology, is “the capacity of a system for doing work.”
  • Energy can take varying forms, such as thermal, electrical, mechanical, nuclear, chemical, gravitational, acoustic, and electromagnetic.
  • Two common measures of energy are British thermal units (Btu) and joules. All forms of energy can be expressed in these units. One Btu is the amount of energy needed to raise the temperature of one pound of water from 39 to 40 degrees Fahrenheit.One joule is the amount of energy needed to lift one hundred grams (3.5 ounces) upward by one meter (3.3 feet) while on the surface of the earth.[6]
  • As a consequence of the First Law of Thermodynamics, energy and matter cannot be created or destroyed; they can only be transformed from one form into another.[7] [8] [9] [10]
  • As a consequence of the Second Law of Thermodynamics, when energy is transformed from one form to another, some of it disperses, thus making it less useful for performing work. [11] [12] [12] [14]

  • just-facts-energy 150Practical Uses 

    • Humans have learned to harness energy to accomplish tasks such as transporting people and products, heating and cooling homes, farming, cooking, manufacturing goods, communicating across vast distances, and generating light. [15]
    • The average annual energy consumption in the U.S. is 309,000,000 Btu per person. To generate this amount of energy through physical human effort (like pedaling bicycles to drive generators) would require 208 people working nonstop for a year. [16]
    • “Embodied energy” refers to the energy used in making materials. For example, to make a common clay brick weighing 5 pounds requires about 5,386 Btu of energy. The materials of a typical house embody about 850 million Btu, which is equivalent to the energy that would be generated by 573 people pedaling bicycles nonstop for a year. [17]

    Economic Impacts

    • In 2013, energy expenditures in the U.S. were 8.3% of gross domestic product (GDP), or $1.4 trillion ($1,383,045,600,000).[18] In inflation-adjusted 2015 dollars,[19] this amounts to $4,446 for every U.S. resident or $11,491 per household.[20] [21]
Energy Spending as a Share of GDP

[22]

The costs of most products are affected by the costs of energy, even products with low embodied energies because the costs of energy affect the costs of transporting products. Because energy costs influence the costs of products, higher energy costs tend to drive up unemployment, drive down wages, and cause other negative economic effects. Such consequences tend to be harsher in poorer nations.[23] [24] [25]
Roughly one third of the world’s population does not have access to modern forms of energy. In these areas, people use biomass (primarily wood) for about 80% of their energy, and women and children spend an average of 9-12 hours a week collecting firewood. Per the Institute for Plasma Physics in the Netherlands:
Poor people spend a large part of their time collecting the energy they need. This time cannot be spent in producing things that can be sold, working on the land, or learning. This is called the poverty trap: once you are poor, it is very hard to get out of poverty again, because you need to spend all your time in survival activities. This normally leaves very little time to do things that might get you out of poverty, like education, or production of goods to sell on the market.[26] [27]

  • Higher energy costs drive up the costs of food.[28] This has greater impacts on poorer nations and individuals because they spend a larger portion of their income on food.[29] [30] In Haiti during 2007 and 2008, higher energy prices contributed to increased food prices, driving Haiti’s poorer people to obtain nourishment from cookies made of mud.[31]
  • Per the Congressional Research Service, “The economic well-being and economic security of the nation depends on having stable energy sources.”[32]
  • Per the U.S. Government Accountability Office, “Americans’ daily lives, as well as the economic productivity of the United States, depend on the availability of energy….”[33]
  • Per the textbook Introduction to Air Pollution Science, “The availability of affordable electric power is essential for public health and economic prosperity.”[34]

Per the U.S. Energy Information Administration:

  • “Liquid fuels play a vital role in the U.S. energy system and economy, and access to affordable liquid fuels has contributed to the nation’s economic prosperity.”
  • “Cheaper energy allows the economy to expand further….”
  • “increasing energy production has immediate benefits for the economy.”[35] [36]
  • Per the textbook Microeconomics for Today, countries with slower economic growth “are less able to satisfy basic needs for food, shelter, clothing, education, and health.”[37]

U.S. Energy Supplies

During 2015:

  • Petroleum supplied 36.2% of all primary energy consumed in the U.S.
  • Natural gas supplied 29.0%.
  • Coal supplied 16.1%.
  • Nuclear supplied 8.5%.
  • Hydroelectric supplied 2.4%.
  • Biofuels supplied 2.2%.
  • Wood supplied 2.1%.
  • Wind supplied 1.9%.
  • Solar supplied 0.5%.
  • Biowaste supplied 0.5%.
  • Geothermal supplied 0.2%.[38]
Sources of Primary Energy

[39]

  • The following graphs show the components of U.S. energy consumption over time. The first graph shows consumption measured in BTUs. The rest show consumption measured as a portion of total U.S. energy consumption. Each succeeding graph uses a smaller scale to provide increasing resolution.
  • The following graphs show the components of U.S. energy consumption over time. The first graph shows consumption measured in BTUs. The rest show consumption measured as a portion of total U.S. energy consumption. Each succeeding graph uses a smaller scale to provide increasing resolution.
Primary Energy Consumption

[40] [41] [42]

Fossil Fuel and Nuclear Energy Consumption

[43]

Renewable Energy Consumption

[44]

Low-Production Renewable Energy Consumption

[45]

* Data from the graphs above:

Components of U.S. Energy Consumption

Source

1950

1960

1970

1980

1990

2000

2010

2015

Petroleum

38.5%

44.2%

43.5%

43.8%

39.7%

38.7%

36.4%

36.2%

Natural Gas

17.2%

27.5%

32.1%

25.9%

23.2%

24.1%

25.2%

29.0%

Coal

35.7%

21.8%

18.1%

19.8%

22.7%

22.8%

21.4%

16.1%

Nuclear

0.0%

0.0%

0.4%

3.5%

7.2%

8.0%

8.7%

8.5%

Hydroelectric

4.1%

3.6%

3.9%

3.7%

3.6%

2.8%

2.6%

2.4%

Biofuels

N/A

N/A

N/A

N/A

0.1%

0.2%

1.9%

2.2%

Wood

4.5%

2.9%

2.1%

3.2%

2.6%

2.3%

2.0%

2.1%

Wind

N/A

N/A

N/A

N/A

0.0%

0.1%

0.9%

1.9%

Biowaste

N/A

N/A

0.0%

0.0%

0.5%

0.5%

0.5%

0.5%

Geothermal

N/A

0.0%

0.0%

0.1%

0.2%

0.2%

0.2%

0.2%

Solar

N/A

N/A

N/A

N/A

0.1%

0.1%

0.1%

0.5%

[46]


Sectors & Electricity

  • The U.S. Energy Information Administration (EIA) divides the energy market into four major sectors: residential,[47] commercial,[48] transportation,[49] and industrial.[50] [51]
  • In 2014, the residential sector consumed 22% of all U.S. energy, the commercial sector consumed 18%, the transportation sector consumed 28%, and the industrial sector consumed 32%.[52]
  • EIA sometimes classifies “electric power” as separate sector,[53] although the electricity produced by this sector is consumed by the four major sectors.[54]
  • In 2014, the electric power sector consumed 39% of all U.S. energy.[55]
  • Per the Institute for Plasma Physics in the Netherlands:
  • “Electricity is the most flexible form of energy: it can be used for virtually any application.”
  • Using electricity to generate heat “is normally much more expensive than using fossil fuels, and it is only used for relatively small amounts of heat.”
  • “Electricity is also quite hard to store in large quantities. You need large, heavy batteries to store a reasonable amount of electrical energy.”
  • “The central generation of electricity means it has to be distributed over the country in order to bring it to your house. This causes an average loss of energy of 10%, and needs a large and expensive distribution system.”[56]

* During 2015:

  • Coal generated 33.2% of all electricity produced in the U.S.
  • Natural gas generated 32.7%.
  • Nuclear generated 19.5%.
  • Hydroelectric generated 6.0%.
  • Wind generated 4.7%.
  • Wood generated 1.0%.
  • Solar generated 0.9%.
  • Petroleum generated 0.7%.
  • Biomass (other than wood) generated 0.5%.
  • Geothermal generated 0.4%.[57]
Sources of U.S. Electricity

[58]

Economic growth is a key factor in the growth of electricity generation.[59]
The following graphs show the components of U.S. electricity generation over time. The first graph shows generation measured in kilowatt hours. The rest show generation measured as a portion of total U.S. electricity generation. Each succeeding graph uses a smaller scale to provide increasing resolution.

U.S. Electricity Generation by Category

[60]

Electricity Generation by Major Source

[61]

Electricity Generation by Minor Source

[62]

(To be continued)

Email this author

Posted in Energy | Comments Off on Energy Facts & Figures for Dummies Part I

Virginia’s Economy Needs a Real Boost

Share this article on:

virginia-outline-150Government bad news is oftentimes released late on a Friday afternoon when the taxpayers and voters are least likely to be paying attention.

Late on Friday afternoon, July 8, after most folks were heading home or starting their vacations, the Governor announced that the state’s budget was going to be $266 million short of its goal.
That budget shortfall for this past fiscal year, likely means a $500 million deficit for the two year budget unless something dramatic happens.  But don’t count on it.
State employees, teachers, college faculty and sheriff deputies will not see the pay increases they had hoped for and which the legislators and governor had agreed to. The money isn’t there.
This shortfall should not be a surprise.  Government policies or lack of action has consequences and in this case it is reflected in these recent numbers that show an economy not moving forward. An economy languishing, limping along, barely growing.
Federal government anti-growth policies are having an impact.  Obamacare cut the definition of “part time employment” from 35 hours to working only 29 hours. And part time employees do not have to be covered in a company’s health care under the misnamed Affordable Care Act.  So many hourly employees have seen their hours cut by 17% over the past few years.  And now the “new definition” of overtime, and who needs to be paid for working more than 40 hours, is also reducing payrolls.  Of course, we all know that many of those working today are paid less than in years past, and millions have dropped out of the workforce.
On top of this, federal policies are putting thousands of Virginia coal miners out of work.  And when that happens, it impacts all those businesses that rely on these folks’ payrolls – clothing stores, restaurants, hardware stores, grocery stores, etc.
So, of course, payroll and income taxes coming into the state treasury are not what our state government wanted.  Projections of future economic growth were not accurate because the impacts of federal government policies were underestimated.
But we are also seeing a serious reduction of federal spending in Virginia. Billions of dollars less in federal government spending are coming into Virginia.  And this is likely to continue.
So what can we do to build our economy and put more people on private sector payrolls and thus increase the total taxes paid into our state treasury?
For several years, the Thomas Jefferson Institute has urged our elected leaders to tackle real tax reform.  Yet, we struggle under an antiquated tax code crafted about 45 years ago.
Our current tax system was created for a different economic era so it needs to be re-designed to better reflect today’s economy.  Our current state tax system was passed when Richard Nixon was president; the Vietnam War was raging, and John Wayne and Elvis were top entertainers. Cell phones did not exist and Selectric typewriters and not computers were on our desks.
Virginia’s tax system is way too old and out-of-date to give our economy the boost that’s needed.
For too long Virginia has not taken the actions necessary to reflect the clear fact that our reliance on federal government spending is not healthy.  Not only is the consequence of sequestration a continued drag on our state’s economy but so is our aging tax system.
Our political leaders need to rewrite the tax code.  As a starting point, the Thomas Jefferson Institute has proposed a tax restructuring idea that can create close to 70,000 new jobs over the next five years.  It gives all Virginians a tax break, eliminates two oppressive business taxes that discourage hiring – the gross receipts tax and the Machine and Tool tax, and it broadens the sales tax to better reflect today’s service economy.  This tax restructuring plan is revenue neutral and Virginia’s localities will be kept whole, they will not be harmed.  It encourages economic growth by simply re-arranging the tax system to bring jobs to our state and grow our economy. The total “government take” will be the same.  But with 70,000 new jobs, our economy will grow and expand.
Had the state adopted this tax restructuring plan a few years ago we would likely not be facing the economic “wet blanket” that we were presented with earlier this month.
It’s time for serious action to encourage economic growth.  Our state elected officials can’t change federal policy, but they can create a strong business climate, where more and more people are employed in good paying jobs, and where we rely on the private sector and not the federal government to grow our economy.
The longer we wait to take this action, the longer our economy will languish.
Email this author

Posted in Economic Development, Economy, Top Story | Comments Off on Virginia’s Economy Needs a Real Boost

Why We Can’t Live Without Autonomous Vehicles

Share this article on:

Koala-front2-180x180What if an airliner, loaded with 400 passengers, fell from the sky, killing everyone aboard? What if it happened every year? Every week? Every day?
What if it happened every three hours?
You’d probably think twice before booking airfare for your next vacation.
Yet collectively we think nothing of getting in our cars every day, despite the fact that 1.2 million people die each year in automobile accidents worldwide. This is the rough equivalent of that hypothetical jumbo jet dropping from the sky every few hours. 38,000 of those actual recorded deaths are in the United States alone according to the National Safety Council. Automobile fatalities are the #1 cause of death globally for people aged 3-34 years old. $1 trillion in economic damage occurs just in the U.S. each year via car accidents. Despite our remarkable vehicle safety advancements and improvements, such as seatbelts (1959), anti-lock brakes (1971), airbags (1973) and ‘automatic collision avoidance’ technology (2003), we had not found a solution to this preventable epidemic of death and destruction. Until now.
The answer is elegantly simple. We human beings thus far still remain part of the driving equation.
Remove that core element, and everything changes. This technological evolution in human affairs is unstoppable, and autonomous/driverless vehicles will literally reshape our economy, culture and ultimately our world. But let’s unpack these radical pronouncements, and first accept that it’s not far-off fantasy; it’s already happening all around us, right where we live and breathe, right now.
Horribly, human error is responsible for 94 percent of vehicle crashes in the world. Let that number sink in. Part of this awful figure is the 70% of drivers who admit to using their mobile phones while driving. Plus 112 million annually who operate vehicles under the influence of alcohol. Then add the millions more who drive while fatigued, medicated, with failing eyesight and reaction times, and are possibly otherwise impaired or distracted. The obvious solution and alternative to accidents and deaths is to remove the human driver–every human driver–from the driving equation.
Is that really safer, you ask? If you’ve seen recent news reports, you’ve heard of a Tesla Motors accident in Florida, where a Model-S drove down a highway in semi-autonomous “AutoPilot” mode, which failed to recognize a tractor-trailer pulling out in front of it. The Model-S went under the trailer–at full speed–shearing off its roof and killing the driver, who as early accident reports indicated, was not only not paying attention to the road, but was also watching a Harry Potter movie on a portable DVD player. Until this accident, Tesla vehicles had collectively driven more than 130 million miles with the semi-autonomous “AutoPilot” feature engaged. This is significant, since in the United States there is an auto fatality every 94 million miles on average. Worldwide, there is an auto fatality every 60 million miles.
Semi-autonomous and autonomous vehicles are being developed and can save us from ourselves. In May of 2013, the National Highway Transportation Safety Administration (NHTSA) released its official policy on autonomous vehicle development, which is to provide guidance to the states and permit testing of emerging vehicle technologies on their roads. New and updated NHTSA guidelines are imminent and expected in July of 2016. These forward-looking parameters will specifically identify which aspects of autonomous vehicle regulation will be uniform and which will be left to the states’ discretion. NHTSA created four levels of autonomy; Function-specific Automation (Level 1); Combined Function Automation (Level 2); Limited Self-Driving Automation (Level 3); and Full Self-Driving Automation (Level 4).
As the levels ascend, automation takes over, arriving finally at Level 4, in which a vehicle is designed to perform all safety-critical driving functions and monitor roadway conditions for an entire trip. This design anticipates that a human will provide destination or navigation input, but this “driver” is not expected to be available for control at any time during the trip. This includes both occupied and unoccupied vehicles. At Level 4, there is not even the reassuring presence of a steering wheel or a brake pedal.
Here in the Commonwealth of Virginia, all four levels of vehicle autonomy are already on our roads. Ford’s 2016 lineup of vehicles offers menus incorporating more than 30 different options of semi-autonomous (Level 1-2) features. In June of 2015, Virginia designated a 70-mile circle, encompassing Interstates 66, I-495, I-95, and State Routes 29 and 50, as “Virginia Automated Corridors,” marking them as locations where automakers can test each level and mode of autonomous vehicle operation. These corridors also include two test tracks: the Virginia International Raceway, and the Virginia Smart Road at the Virginia Tech Transportation Institute. Governor McAuliffe and the General Assembly have worked in tandem to ensure there are no statutory or regulatory barriers to members of the automotive industry who wish to test automated and autonomous vehicles in Virginia. This form of ‘naturalistic’ testing is extremely vital to the autonomous vehicle industry–an industry projected to spend more than $25 billion on research and have more than 10 million autonomous vehicles on the road by 2020.
While fully-autonomous vehicles (Level 4) remain 20 to 30 years away, both the Governor and General Assembly in Richmond have shown commendable leadership together, getting well ahead of and in front of this emerging technology. Our elected lawmakers here agree that it’s not too early to get into what Ford Motor Company alone believes will prove to be a $5.4 trillion per year autonomous transportation marketplace. For perspective, the entire current automotive industry, which is expected to hit peak production in 2017, is currently estimated at $2 trillion annually. Better yet, McKinsey & Company predicts that by the time self-driving cars become our primary form of transport (sometime prior to 2050), the total number of vehicle crashes will have decreased by 90 percent, with a potential for a combined and total cash savings of more than $190 billion per year. This is to say nothing of the human factor: plummeting fatalities, a fraction of the injuries and almost omnipresent safety when traveling.
And with all those priceless lives preserved and piles of money saved on car repairs, you just might have to book your flight and vacation a whole lot earlier.
For the past eight years, Christopher West has been the Director of Government Relations and Grassroots Outreach at Jackson-West Consulting, LLP, a full-service and bi-partisan government and public affairs firm based in Alexandria, Virginia.
For the latest in autonomous vehicle news follow Chris on Twitter @L4AutoUSA.
For comments and questions, please reach out to him at cwest@jackson-west.com.
For the latest in autonomous vehicle news follow Chris on Twitter @L4AutoUSA.
For comments and questions, please reach out to him at cwest@jackson-west.com.
Christopher West Profile pic-100E-Mail this Author
 

Posted in Technology, Transportation | Comments Off on Why We Can’t Live Without Autonomous Vehicles