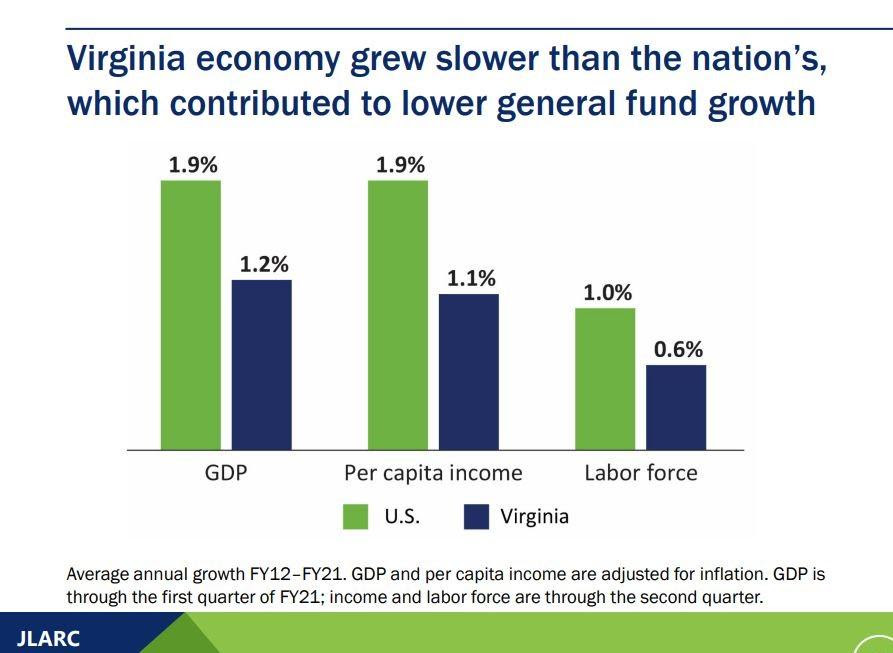
It’s official now: Even the Joint Legislative Audit and Review Commission (JLARC) has documented and highlighted how poorly Virginia’s economy is performing, how far our state is lagging national growth averages.

The admission comes in the most recent summary on state spending trends, an annual report (detailed version here) which was submitted to and approved by the legislators on the panel last week. It covers the ten-year period of 2012-2021 and does a rolling update on previous years.
Virginia’s average annual change in gross domestic product of 1.2% was just 63% of the national average, our per capita income grew 1.1% annually (58% of the national average) and our labor force grew just 0.6% annually over the period, 60% of the national average. The general correlation of the three deficits just demonstrates their interdependence.
During the period, a Democrat sat in the Governor’s Mansion for 80 percent of the time, but it was divided government until recently with Republicans controlling at least one chamber of the legislature for eight of the ten sessions.
Looking back a decade, to the comparable 2011 report, one key measurement jumps out. In the ten years ending in 2011, the state’s population grew 10 percent. That then slowed to 5.4% over the decade in the most recent census. The older population, however, more dependent on some services but paying less in taxes, surged. It grew 20% in the decade ending 2011, then 36% in the past ten years.
The JLARC staff highlighted the weak economy to explain relatively weak general fund tax growth during the period, since income and sales tax collections rise with those economic indicators. But that flat economic output didn’t prevent state government from showing spectacular spending growth. State spending in all categories was $40 billion ten years ago and $67 billion in the fiscal year that ended June 30.
And don’t forget, even with that amazing 68% increase in total state spending, the state ended the 2021 fiscal year with $2.6 billion in unspent general funds, almost $400 million in unspent transportation department funds, and other balances as yet unreported. The revenue surge continues.
The value of the JLARC report is it combines all the various pots of money, something you seldom see in other legislative reports. The host of different funds – general, non-general, special, debt, federal – confuse even those who work with the numbers regularly. But these are all dollars paid by people either as taxes for general operations or fees for specific state services.
It will surprise no one that the ten-year growth in the most recent report was mainly in the non-general fund categories (87% growth in non-general versus 39% in general funds). That’s been the pattern for a long time now. That 2011 report showed an even higher spike of non-general fund spending, 105%, but slower general fund spending growth of 29%.
The 2018 decision to expand Medicaid eligibility brought in a rush of new federal funding and special assessments on hospitals. The Department of Medical Assistance Services (DMAS) grew more than $1 billion annually, accounting for more than one-third of the total state spending growth.
In comparison, the Department of Transportation came in second in total growth, averaging $353 million in additional spending per year. Its growth was fueled by two tax increases during the period, one in approved in 2013 and another in 2020.
Beyond those two, the top ten list is dominated by higher education spending, fueled by steady tuition increases. Four universities (Virginia, Virginia Tech, George Mason and Virginia Commonwealth) and the state category for student financial aid were all among top ten for overall spending growth over the decade. The aid account is obviously chasing higher tuitions across the entire system.
DMAS, Transportation, and the universities are largely non-general fund agencies, less dependent on general fund taxes. The largest surge in non-general funding came in the final three years of the report, fiscal years 2019, 2020, and 2021. In 2019, it was in large part the infusion of federal funds and hospital assessments to cover Medicaid expansion. In 2020 and 2021, most of the growth resulted from the waves of federal COVID-relief funding, about $18 billion accruing to the state in that period.
The Department of Education’s funding for direct aid to local schools showed the strongest growth when only general funds are considered. They grew from about $4.9 billion to just under $6.9 billion, about 40 percent over the period. DMAS appears second on that list for its own consumption of additional general fund dollars for Medicaid, with the state’s hospital and service agency for the mentally ill or disabled coming in third (Department of Behavioral Health and Developmental Services.)
Only two agencies suffered a decline in general fund spending over the period, and they didn’t really. Transportation was receiving extra general fund infusions in 2011 and 2012, which went away with the 2013 funding package. The Department of Business Assistance and Department of Minority Business Enterprise merged, and one of their big grant programs was sent over to the Virginia Economic Development Partnership.
- Trump’s Energy Promises Face Hurdles in Anti-Hydrocarbon Virginia - November 20, 2024
- No, RTD, Hurricane Helene Not Proof of ‘Climate Change’ - October 3, 2024
- A Transparent Effort to Increase General Assembly Authority to Eliminate Hydrocarbon Fuels - September 26, 2024
