Introduction: Each year the Fairfax County Board of Supervisors must choose the real-estate tax rate. The actualdollar amount of the tax is equal to the product of the rate and the assessed value of the real estate. If the dollaramount increases more than the owners income, the tax will be an added burden on the owner. The purpose of thisreport is to provide data by which the rate can justly be chosen.
Analysis of the Revenues
The ability of people to pay taxes depends not so much on the value of the house in which they live as it does ontheir income; therefore, setting the real-estate tax rate should be based on the income. Data for the median income isavailable from 1979 to 2009, inclusive1. Data is readily available for the assessed value of real estate from FY2000through FY20122, with the FY2012 value obtained by an extrapolation made by the County and reported in itsbudget documents. We have taken the data on assessed value and multiplied it by the tax rate for each year sinceFY2000. For FY2012, we have used a tax rate of $1.065 per hundred dollars of assessed value. This rate may becompared to the $1.09 for FY2011. These rates do not include the $0.015 recently added for stormwater management.
The dollar amount of the tax on the median home was nearly constant before 2001, but increased 50% from 2001 to2008 (Exhibit 1). The increase is due to the housing “bubble”, along with a nearly constant tax rate. While the realestatetax was increasing from 2001 to 2008, the median household income, also corrected for inflation, remainednearly constant (Exhibit 1), implying that an increase in real-estate tax is not affordable. (We have multiplied thetax by 20 so the two curves could be more readily compared.) In generating Exhibit 1, we have assumed 1.5%inflation for 2011 and another 1.5% for 2012. We have not extrapolated the income data beyond 2009, the mostrecent data available at the County’s demographics page.
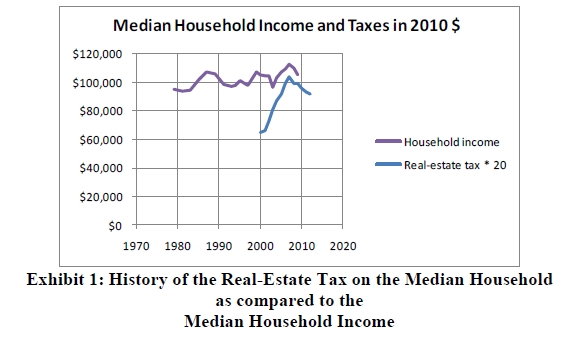
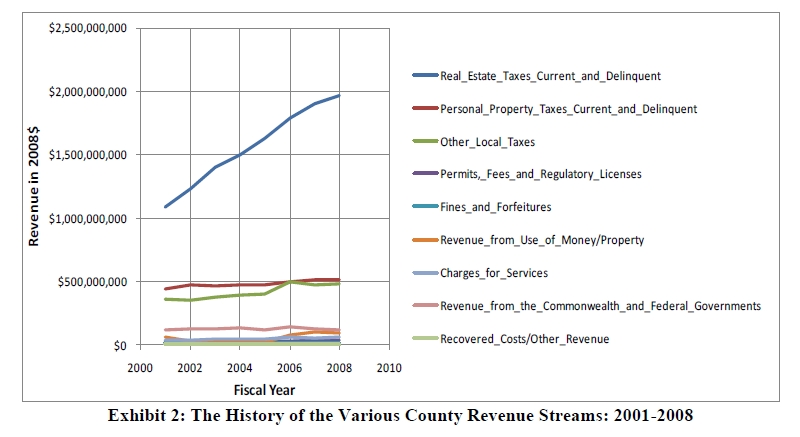
Exhibit 1 illustrates that, instead of decreasing the tax rate to keep the tax relatively constant, the County chose to let the tax increase with the bubble. Other sources of revenue remained relatively constant (Exhibit 2).
The next question to answer is: What was done with the increased revenue? We look next at the expenditures.
 Analysis of the County Expenditures
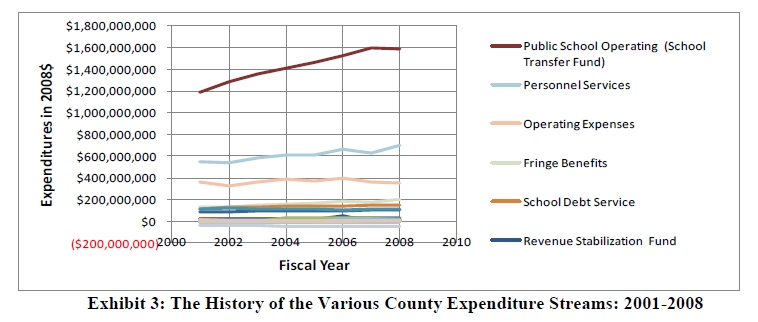
Of the approximately 40 expenditure streams, the school transfer fund increased the most (33%) from 2001 to 2008. The school transfer fund is also the largest single stream (Exhibit 3). Non-school fringe benefits increased 52%, although the magnitude is only 29% that of non-school personnel services. The next largest increase was in personnel services (labor costs), which increased by 27% from 2001 to 2008. We can see that the much of the increased revenue was used for County-worker remuneration.
We next ask: What was done with the increased public-school transfer funds? These funds flow from the County to the Fairfax County public schools, which is free to spend the funds as it wishes.
Analysis of Public School Expenditures
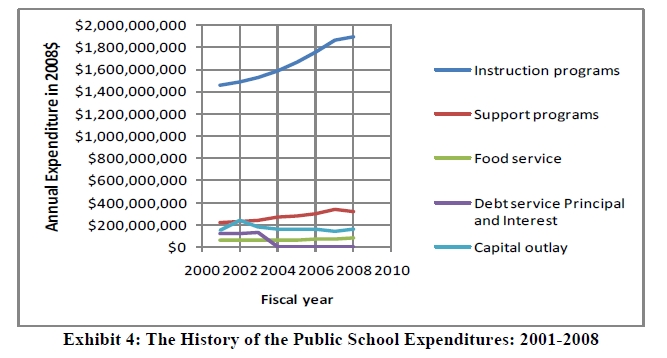
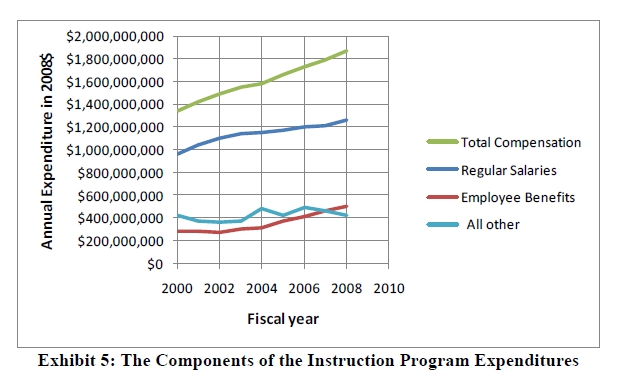
The increase in school budget was spent primarily on the instruction programs (Exhibit 4), which are dominated by labor costs. The increase from 2001 to 2008 is 30%. It occurs on the largest single school expenditure stream. This increase includes a 74% increase in fringe benefits and a 21% increase in salaries (Exhibit 5). Note that all of these expenditures are in 2008 dollars. They have been adjusted for inflation. Note also that we are not looking at the raises of an individual teacher. The curve is a composite for the entire teaching staff. With people retiring and younger people being hired to replace them, while the existing teachers age, we would expect the expenditures to be constant.
Looking again at the change from 2001 to 2008, the budget documents show that the actual number of teachers increased by 9%, although the total educational staff increased by 12%. Both of these exceed the 8% increase in the number of students. The increase in teacher salaries plus benefits3 was 32%. If the newly hired teachers were new graduates, we would expect the average salary to decrease. It didn’t. It increased 28%. In every category except transportation (Exhibit 6), the expenditure per employee, corrected for inflation, increased between 10% and 31%. These increases are over and above inflation. Not only did the teacher remuneration increase, but many more Assistant Principals, Supervisors, Specialists, Instructional Assistants, and Specialized Assistants were added.
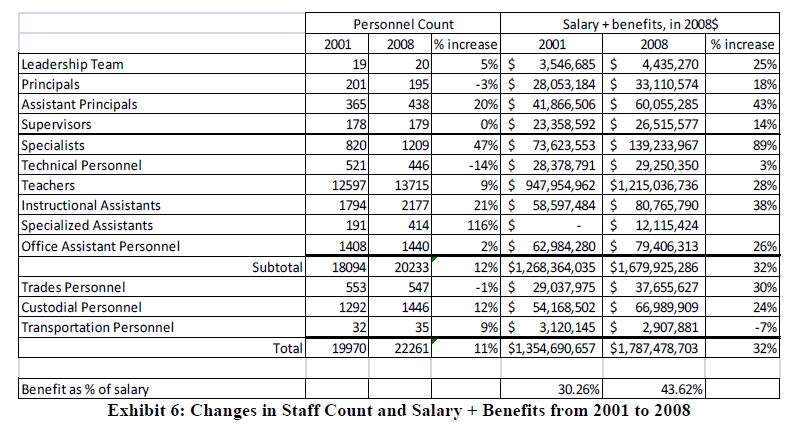
The total expenditure increase in Exhibit 6 matches the increase shown in Exhibit 5; therefore, we have found where the increased revenue from 2001 to 2008 has been spent; namely, on added staff, increased salaries for all teachers, and increased benefits for all teachers.
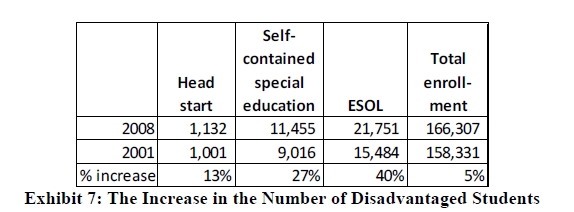
At least some of the increase in number of teachers can be attributed to the increase in the number of disadvantaged students (Exhibit 7). The minority (Black, Asian/Pacific Islander, Native American/Alaskan, other race, and mixed race) percent of the general population in Fairfax County has risen from 30.3% in 2000 to 33.3% in 2009. A sociological study would be needed to determine why the percent increase in the number of disadvantaged students increased so much more than the increase in the minority population. Some of the increase in the number of disadvantaged students may be due to, for example, a greater willingness by the schools to so classify its students.
 Conclusion
The real-estate tax rate should be set in part by the ability of the citizens to pay the tax. The ability can be estimated on the basis of the median household income. Exhibit 1 compares the median household income to the average real-estate tax for Fairfax County, both being adjusted by the CPI-U for inflation.
Because the median income trend is downward, the ability to pay is decreasing; therefore, the real-estate tax rate should be chosen not to increase but possibly to decrease, despite the expected increase in the assessed value of the real estate. A tax rate of $1.065, as shown in the graph, will keep the tax in FY2012 equal to that of FY2011, but, under our assumed 1.5% inflation rate, 1.5% lower in 2010 dollars. Income data for FY2010 is not available from government sources.
The large increase in the revenue was spent on the salaries and fringe benefits of County employees, including teachers and other instructional school personnel. Fringe benefits increased greatly, accounting for much of the increase in salary plus benefits. In addition to increases in remuneration, a 12% increase in instructional personnel added to the expenditures. This increase exceeded the 8% enrollment increase. Many assistants and specialists were added at all levels, although some of the increases might be attributed to the increase in the number of disadvantaged students.
Clearly, an increase in the dollar amount of the real-estate tax is not affordable at this time (FY2012).
- The Most Progressive Budget in Virginia’s History - December 21, 2019
- When is a Clean Water Act Permit Needed? - December 21, 2019
- Should U.S. Consider Modern Monetary Theory to Improve Economy? - December 21, 2019
